

Dow Jones dips as trade uncertainty lingers, consumer sentiment sinks
- China’s tariff exemption talks ease tensions but fail to spark full recovery.
- Trump’s “total victory” remark on tariffs shifts sentiment back to caution.
- UoM sentiment hits 52.2; inflation expectations surge to 6.5% for 2025.
The Dow Jones Industrial Average (DJIA) registered losses of over 0.32% on Friday amid uncertainty over the trade war between the US and China. However, as news broke that China may exempt some US goods from tariffs, Beijing seemed to have de-escalated tensions. This and a deterioration in US consumer sentiment kept the DJIA hovering near 40,000 instead of testing the current week's highs.
DJIA slips as mixed China signals and Trump’s tariff stance weigh on risk mood
Risk appetite remains mixed even though China has adopted a flexible negotiation stance with Washington. Meanwhile, US President Donald Trump's comments that he will consider a “total victory” if the US keeps 20% to 50% tariffs on foreign countries a year from now brought a leg down in the DJIA due to a slight shift in sentiment.
In the meantime, US consumer sentiment in April deteriorated further, as revealed by a poll by the University of Michigan (UoM). The index fell to 52.2 from 57 in March, the fourth lowest reading in data since the late 1970s. The survey showed that expectations for the economy, income, the stock market, and homebuying conditions worsened from a month earlier.
The UoM poll showed that inflation expectations had risen past 4.4% over the next 5 years, with Americans expecting prices to increase at 6.5% for the upcoming 12 months.
US equities are also feeling the pain as rising expectations of a recession in the US have risen from 30% to 45%, according to economists surveyed by Bloomberg.
Aside from this, Gold prices remained pressured by the US Dollar recovery. Bullion prices are down 1.89% at $3,285. At the same time, the US Dollar Index (DXY), which tracks the performance of a basket of six currencies against the US Dollar, rose 0.27% to 99.55.
Dow Jones price forecast
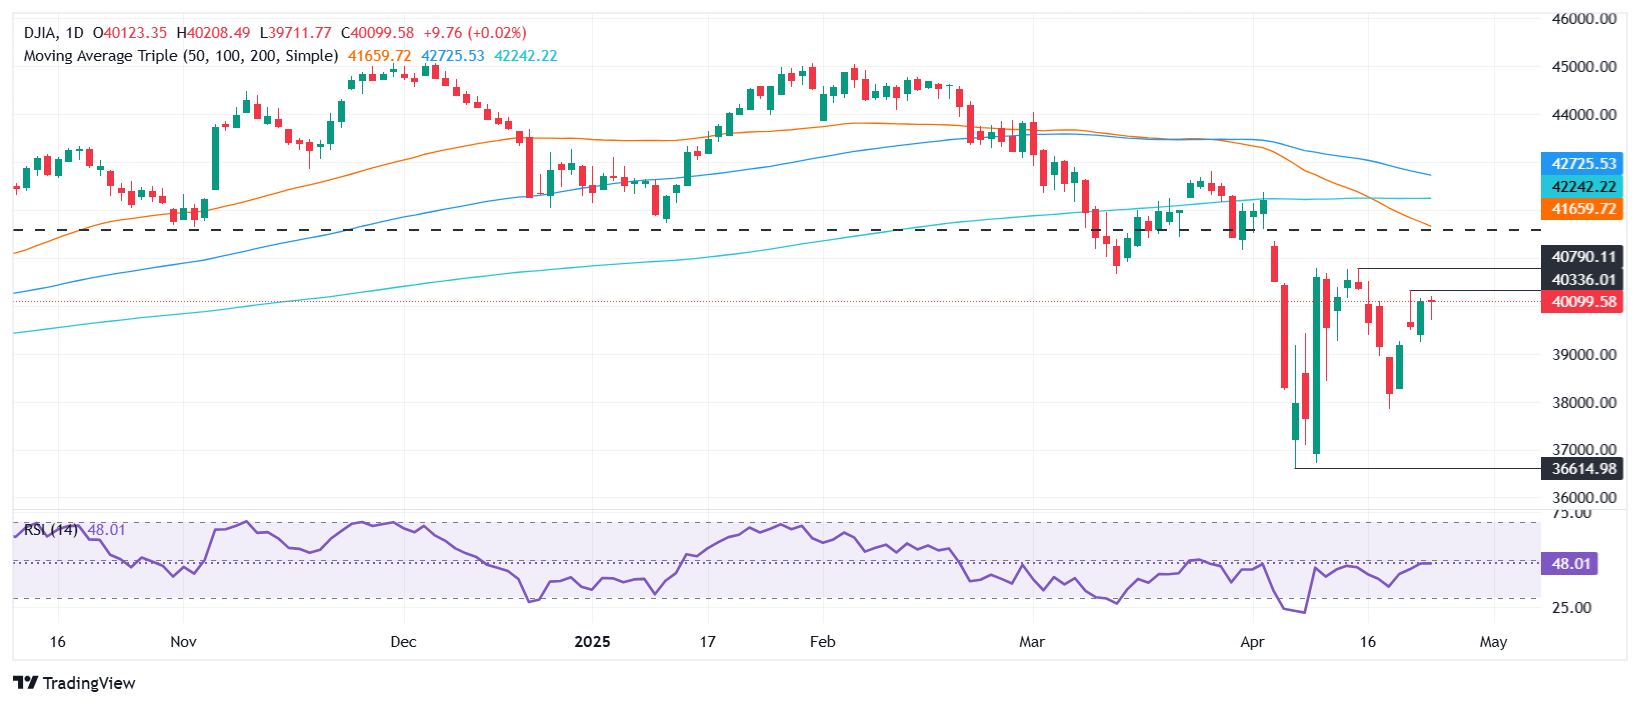
The Dow’s bearish bias hasn’t changed even though the index is set to finish the week with gains of over 2% above the 40,000 mark. The Relative Strength Index (RSI) shows momentum remains neutral, an indication that buyers are struggling to drive the DJIA higher, although sentiment has improved.
If DJIA clears 40,500, the next resistance would be last week’s high at 40,790. Key resistance lies ahead at 41,000. Conversely, if sellers drive the index below April 23’s low of 39,486, look for a test of the April 22 high of 39,271 to close the gap witnessed between April 22 and 23.
Dow Jones FAQs
The Dow Jones Industrial Average, one of the oldest stock market indices in the world, is compiled of the 30 most traded stocks in the US. The index is price-weighted rather than weighted by capitalization. It is calculated by summing the prices of the constituent stocks and dividing them by a factor, currently 0.152. The index was founded by Charles Dow, who also founded the Wall Street Journal. In later years it has been criticized for not being broadly representative enough because it only tracks 30 conglomerates, unlike broader indices such as the S&P 500.
Many different factors drive the Dow Jones Industrial Average (DJIA). The aggregate performance of the component companies revealed in quarterly company earnings reports is the main one. US and global macroeconomic data also contributes as it impacts on investor sentiment. The level of interest rates, set by the Federal Reserve (Fed), also influences the DJIA as it affects the cost of credit, on which many corporations are heavily reliant. Therefore, inflation can be a major driver as well as other metrics which impact the Fed decisions.
Dow Theory is a method for identifying the primary trend of the stock market developed by Charles Dow. A key step is to compare the direction of the Dow Jones Industrial Average (DJIA) and the Dow Jones Transportation Average (DJTA) and only follow trends where both are moving in the same direction. Volume is a confirmatory criteria. The theory uses elements of peak and trough analysis. Dow’s theory posits three trend phases: accumulation, when smart money starts buying or selling; public participation, when the wider public joins in; and distribution, when the smart money exits.
There are a number of ways to trade the DJIA. One is to use ETFs which allow investors to trade the DJIA as a single security, rather than having to buy shares in all 30 constituent companies. A leading example is the SPDR Dow Jones Industrial Average ETF (DIA). DJIA futures contracts enable traders to speculate on the future value of the index and Options provide the right, but not the obligation, to buy or sell the index at a predetermined price in the future. Mutual funds enable investors to buy a share of a diversified portfolio of DJIA stocks thus providing exposure to the overall index.
추천 기사


