
US Dollar extends losses amid US debt concerns
- The US Dollar Index sees the previous day’s relief rally pared back in full on Friday.
- The House of Representatives has passed US President Trump’s spending bill.
- The US Dollar Index ekes out further losses and is on its way to test a fresh two-week low
The US Dollar Index (DXY), which tracks the performance of the US Dollar (USD) against six major currencies, dips further on Friday and erases the previous day’s recovery, trading near 99.40 at the time of writing. The fresh leg lower comes after the House of Representatives passed United States (US) President Donald Trump’s spending bill, now on its way to the Senate. The nonpartisan Congressional Budget Office revealed that this "big, beautiful bill" comes with a hefty price tag: $3.8 trillion in additional debt to the federal government's $36.2 trillion over the next decade, according to Reuters.
Markets, and indeed the bond market, have been very concerned about these numbers. The best example was the longer-term 30-year Bond, where yields rallied to 5.15% on Thursday from 4.64% at the start of May, a more than one-year high since the 5.18% seen at the end of December 2023. More concerns could devalue the US Dollar even further.
Daily digest market movers: Fed takes over again
- President Trump threatens with a 50% tariff on all EU goods from June 1st and a 25% tariff on Iphones if they are not made in the US.
- At 12:35 GMT, St. Louis Fed President Alberto Musalem participates in a fireside chat with Kansas City Fed President Jeff Schmid at the Heartland Health Institute, Benthoville.
- At 14:00 GMT, April’s New Home Sales data will be released.
- At 16:00 GMT, Federal Reserve Bank Governor Lisa Cook speaks on financial stability at the Seventh Annual Women in Macro Conference.
- Equities are in positive territory this Friday with marginal gains for European indices and some small gains for US futures ahead of the opening bell.
- The CME FedWatch tool shows the chance of an interest rate cut by the Federal Reserve in June’s meeting at just 5.3%. Further ahead, the July 30 decision sees odds for rates being lower than current levels at 28.2%. Recent hawkish comments from Fed officials have reduced the chances of a rate cut in the short term.
- The US 10-year yields trade around 4.51%, cooling down from their peak performance earlier this week at 4.62%.
US Dollar Index Technical Analysis: Has room to the downside
The US Dollar Index is back to square one, flirting with a fresh two-week low at the time of writing near 99.40. With the spending bill now having cleared that first hurdle, the risk of a substantial shock effect in the US debt could further materialise. Even another cut in its credit rating might be under consideration, denting the US image and the US Dollar even further.
On the upside, the broken ascending trend line and the 100.22 level, which held the DXY back in September-October, are the first resistance zone. Further up, the 55-day Simple Moving Average (SMA) at 101.49 is the next level to watch out for, followed by 101.90, a pivotal level throughout December 2023 and as a base for the inverted head-and-shoulders (H&S) formation during the summer of 2024. In case Dollar bulls push the DXY even higher, the 103.18 pivotal level comes into play.
If the downward pressure continues, a nosedive move could materialize towards the year-to-date low of 97.91 and the pivotal level of 97.73. Further below, a relatively thin technical support comes in at 96.94 before looking at the lower levels of this new price range. These would be at 95.25 and 94.56, meaning fresh lows not seen since 2022.
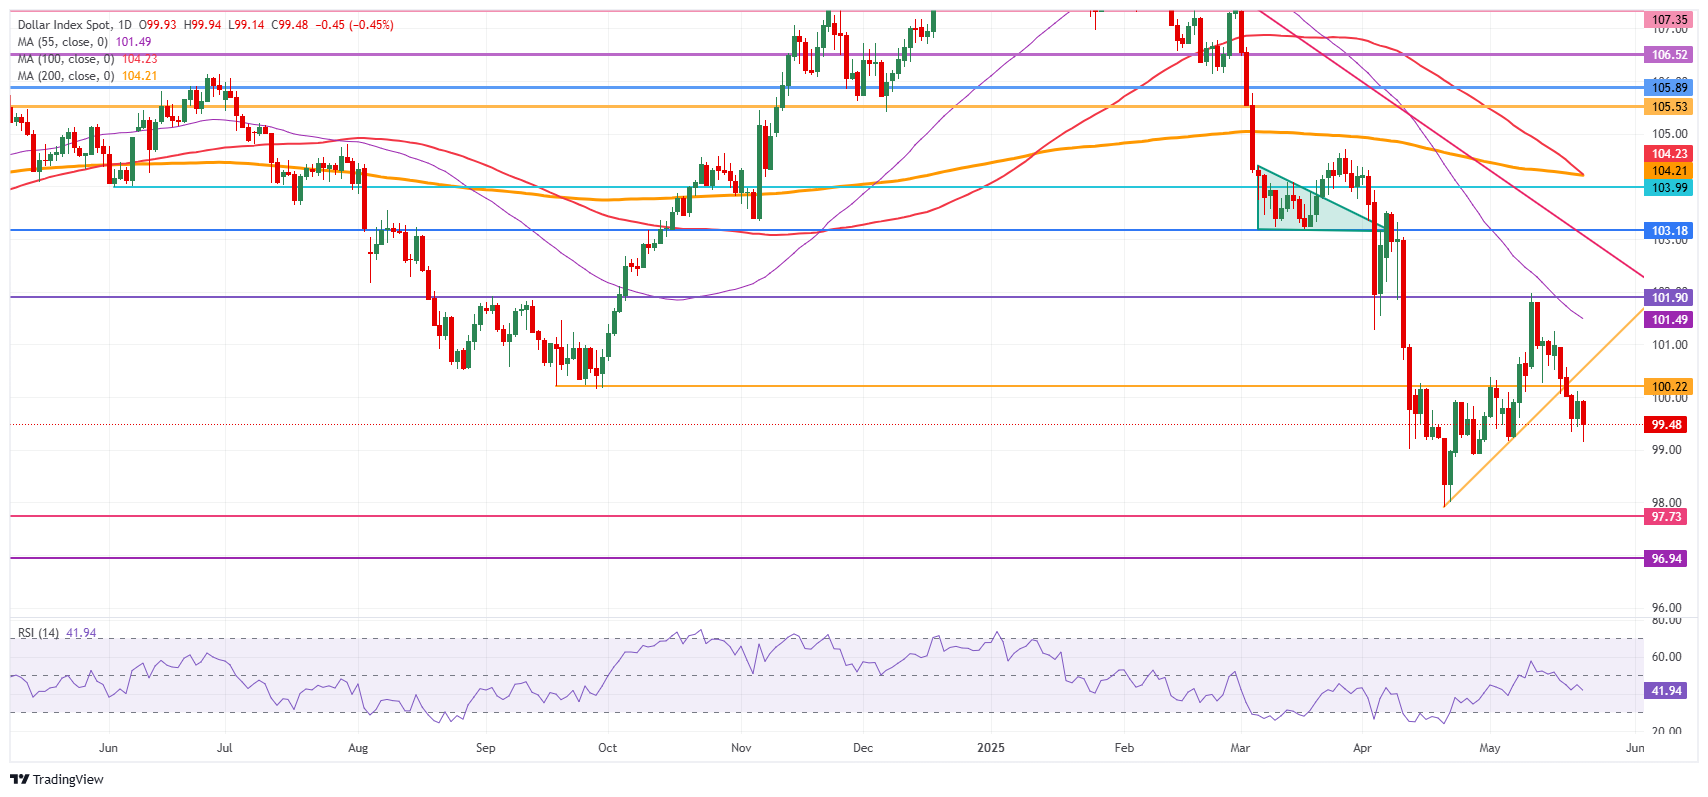
US Dollar Index: Daily Chart
US-China Trade War FAQs
Generally speaking, a trade war is an economic conflict between two or more countries due to extreme protectionism on one end. It implies the creation of trade barriers, such as tariffs, which result in counter-barriers, escalating import costs, and hence the cost of living.
An economic conflict between the United States (US) and China began early in 2018, when President Donald Trump set trade barriers on China, claiming unfair commercial practices and intellectual property theft from the Asian giant. China took retaliatory action, imposing tariffs on multiple US goods, such as automobiles and soybeans. Tensions escalated until the two countries signed the US-China Phase One trade deal in January 2020. The agreement required structural reforms and other changes to China’s economic and trade regime and pretended to restore stability and trust between the two nations. However, the Coronavirus pandemic took the focus out of the conflict. Yet, it is worth mentioning that President Joe Biden, who took office after Trump, kept tariffs in place and even added some additional levies.
The return of Donald Trump to the White House as the 47th US President has sparked a fresh wave of tensions between the two countries. During the 2024 election campaign, Trump pledged to impose 60% tariffs on China once he returned to office, which he did on January 20, 2025. With Trump back, the US-China trade war is meant to resume where it was left, with tit-for-tat policies affecting the global economic landscape amid disruptions in global supply chains, resulting in a reduction in spending, particularly investment, and directly feeding into the Consumer Price Index inflation.
추천 기사


