

Dow Jones Industrial Average cools as post-election rally chills
- The Dow Jones eased on Thursday as Trump election rally short-circuits.
- US producer-level prices printed at expectations, easing investor concerns.
- Friday brings Retail Sales data to round out the trading week.
The Dow Jones Industrial Average (DJIA) pumped the brakes on the recent post-election rally that saw a decisive win for presidential candidate and former President Donald Trump. Investors overwhelmingly perceived the returning contender for the White House as a pro-market representative within the US government. The election glut in equities is now fizzling out as equities pare back slightly from record highs.
Producer Price Index (PPI) producer-level inflation figures came in roughly as expected, despite a slight upswing in annualized core PPI numbers. Headline PPI matched forecasts in October, rising 0.2% MoM compared to the previous month’s revised 0.1%. Core PPI for the year ended in October accelerated more than expected, ticking up to 3.1% compared to the expected 3.0% rising above the previous period’s 2.9%, which was also revised slightly higher from 2.8%.
US Retail Sales are due on Friday and is the last batch of meaningful US data on the docket this week. October’s Retail Sales are expected to ease to 0.3% MoM from the previous 0.4%, while Retail Sales excluding automobiles are expected to decline to 0.3% from 0.5%.
Dow Jones news
The Dow Jones is roughly on-balance on Thursday despite a slight easing in the index’s headline average price. Half of the Dow’s constituent equities are in the green for the day, with gains led by Walt Disney (DIS). Disney is up nearly 7% for the day and testing $110 per share after beating earnings in FY Q4. On the low side, Salesforce (CRM) eased lower around 2.5% to $333 per share as the AI-fueled tech rally takes a breather on Thursday.
Dow Jones price forecast
The Dow Jones is struggling to hold onto the 44,000 handle as the major equity index eases back from record highs set just north of 44,4000. Downside potential remains limited as bears have few footholds to grab onto, but a near-term downturn to the 50-day Exponential Moving Average (EMA) near 42,400 can’t be discounted.
The Dow Jones is still trending deep into bull country regardless of any near-term drags; the index is on pace to close in the green for all but two months of 2024. The DJIA is also trading well above it’s 200-day EMA near 40,150, with nearly 10% of value between current price action and the long-term moving average.
Dow Jones daily chart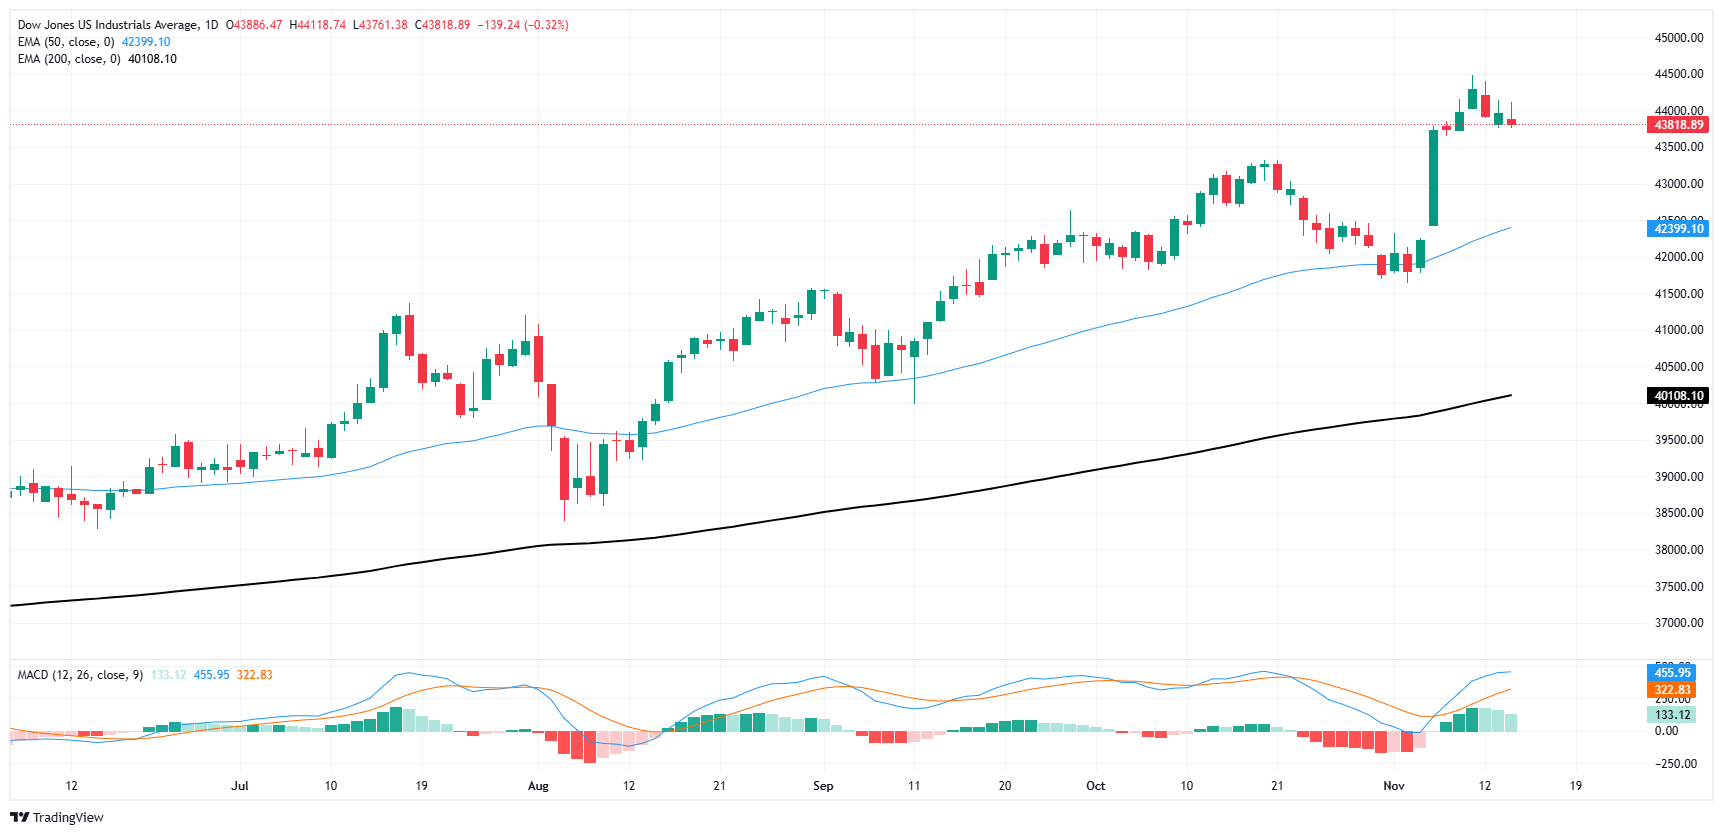
Dow Jones FAQs
The Dow Jones Industrial Average, one of the oldest stock market indices in the world, is compiled of the 30 most traded stocks in the US. The index is price-weighted rather than weighted by capitalization. It is calculated by summing the prices of the constituent stocks and dividing them by a factor, currently 0.152. The index was founded by Charles Dow, who also founded the Wall Street Journal. In later years it has been criticized for not being broadly representative enough because it only tracks 30 conglomerates, unlike broader indices such as the S&P 500.
Many different factors drive the Dow Jones Industrial Average (DJIA). The aggregate performance of the component companies revealed in quarterly company earnings reports is the main one. US and global macroeconomic data also contributes as it impacts on investor sentiment. The level of interest rates, set by the Federal Reserve (Fed), also influences the DJIA as it affects the cost of credit, on which many corporations are heavily reliant. Therefore, inflation can be a major driver as well as other metrics which impact the Fed decisions.
Dow Theory is a method for identifying the primary trend of the stock market developed by Charles Dow. A key step is to compare the direction of the Dow Jones Industrial Average (DJIA) and the Dow Jones Transportation Average (DJTA) and only follow trends where both are moving in the same direction. Volume is a confirmatory criteria. The theory uses elements of peak and trough analysis. Dow’s theory posits three trend phases: accumulation, when smart money starts buying or selling; public participation, when the wider public joins in; and distribution, when the smart money exits.
There are a number of ways to trade the DJIA. One is to use ETFs which allow investors to trade the DJIA as a single security, rather than having to buy shares in all 30 constituent companies. A leading example is the SPDR Dow Jones Industrial Average ETF (DIA). DJIA futures contracts enable traders to speculate on the future value of the index and Options provide the right, but not the obligation, to buy or sell the index at a predetermined price in the future. Mutual funds enable investors to buy a share of a diversified portfolio of DJIA stocks thus providing exposure to the overall index.
추천 기사


