

Dow Jones Industrial Average tests fresh record high as Fed rate call looms
- The Dow Jones cracked a fresh all-time high during Monday trading.
- Despite the upside stretch, equities remain tepid overall.
- Investors are buckling down for the wait to Wednesday’s Fed rate call.
The Dow Jones Industrial Average (DJIA) clipped into another record intraday bid to kick off the new trading week. The largest equities on the New York Stock Exchange (NYSE) inched higher on Monday, ahead of Wednesday’s Federal Reserve (Fed) rate call, which is widely expected to be the Fed’s first rate cut since March of 2020.
The Fed kicking off a new rate-cutting cycle on Wednesday is all but a given according to investors, and it now comes down to a debate of how much rather than when. According to the CME’s FedWatch Tool, rate traders are pricing in around 60% odds that the Fed’s first rate cut in over four years will be a 50 bps decline in the Fed funds rate, with the remaining 40% expecting a more demure 25 bps. Rate markets are also pricing in a total of 125-150 bps in cuts by the end of the year, with interest rate traders seeing a roughly 80% chance that the Fed funds rate will hit 400-425 total bps by December 18 versus the current interest rate of 525-550.
US Retail Sales are slated for an update on Tuesday, but the key datapoint that would normally drive some level of volatility is not expected to move the needle this week unless the print comes in wildly out of alignment with forecasts. MoM US Retail Sales growth in August is expected to ease back to 0.2% from July’s 1.0%, while core MoM Retail Sales (excluding automotive purchases) are expected to tick down to 0.3% from 0.4%.
Dow Jones news
Despite an overall tepid tone in US equities on Monday, the Dow Jones has tilted into the bullish side, rising around 130 points and adding 0.3% at the current average near 41,500. The DJIA clipped a new record intraday bid of 41,738 before settling back as investors bide their time.
Intel Corp (INTC) added 2.5%, climbing over $20 per share after it was revealed that the chipmaker was set to receive a $3.5 billion grant from the US government to produce chipsets for the US military and the Pentagon. Despite the Monday pop, INTC is barely off of its decade-plus lows and has yet to recover ground after missing an earnings call in August. A technical recovery has yet to materialize after the silicon giant gleefully announced they would axe over 15,000 employees in a bid to appease shareholders and try to backstop the company’s share value decline of nearly 60% YTD.
On the low end, Apple Inc (AAPL) tumbled -3.3% to $215 per share after reports surfaced that demand for the company’s 16th iteration of its iPhone platform may not be as high as many anticipated. According to analysts, key AI-driven features that Apple was banking on to revive flagging sales figures are still not publicly available, flattening phone sales. At the same time, extended shipping times are further shaking out potential buyers. Sales for the company’s latest annual mobile phone update are down 12% YoY, according to analysis from TF Securities.
Dow Jones price forecast
Despite an overall tepid stance to stock trading on Monday, the Dow Jones is still finding plenty of room on the bidding side, clipping into a fresh all-time high and rounds the corner into a fourth straight trading day of gains. The major equity index has recovered nearly 4.4% bottom-to-top from last week’s swing low below 40,000.
With the DJIA recovering back above the 50-day Exponential Moving Average (EMA) rising through 40,450, action is squarely planted on the bullish side, though long-term bidders will be cautious with price action cycling familiar technical levels. This isn’t the first time the Dow Jones has priced in a topping pattern ahead of major news events, and despite having a short-term memory issue, buyers can still recall July’s bumpy -7.2% decline from previous record highs.
Dow Jones daily chart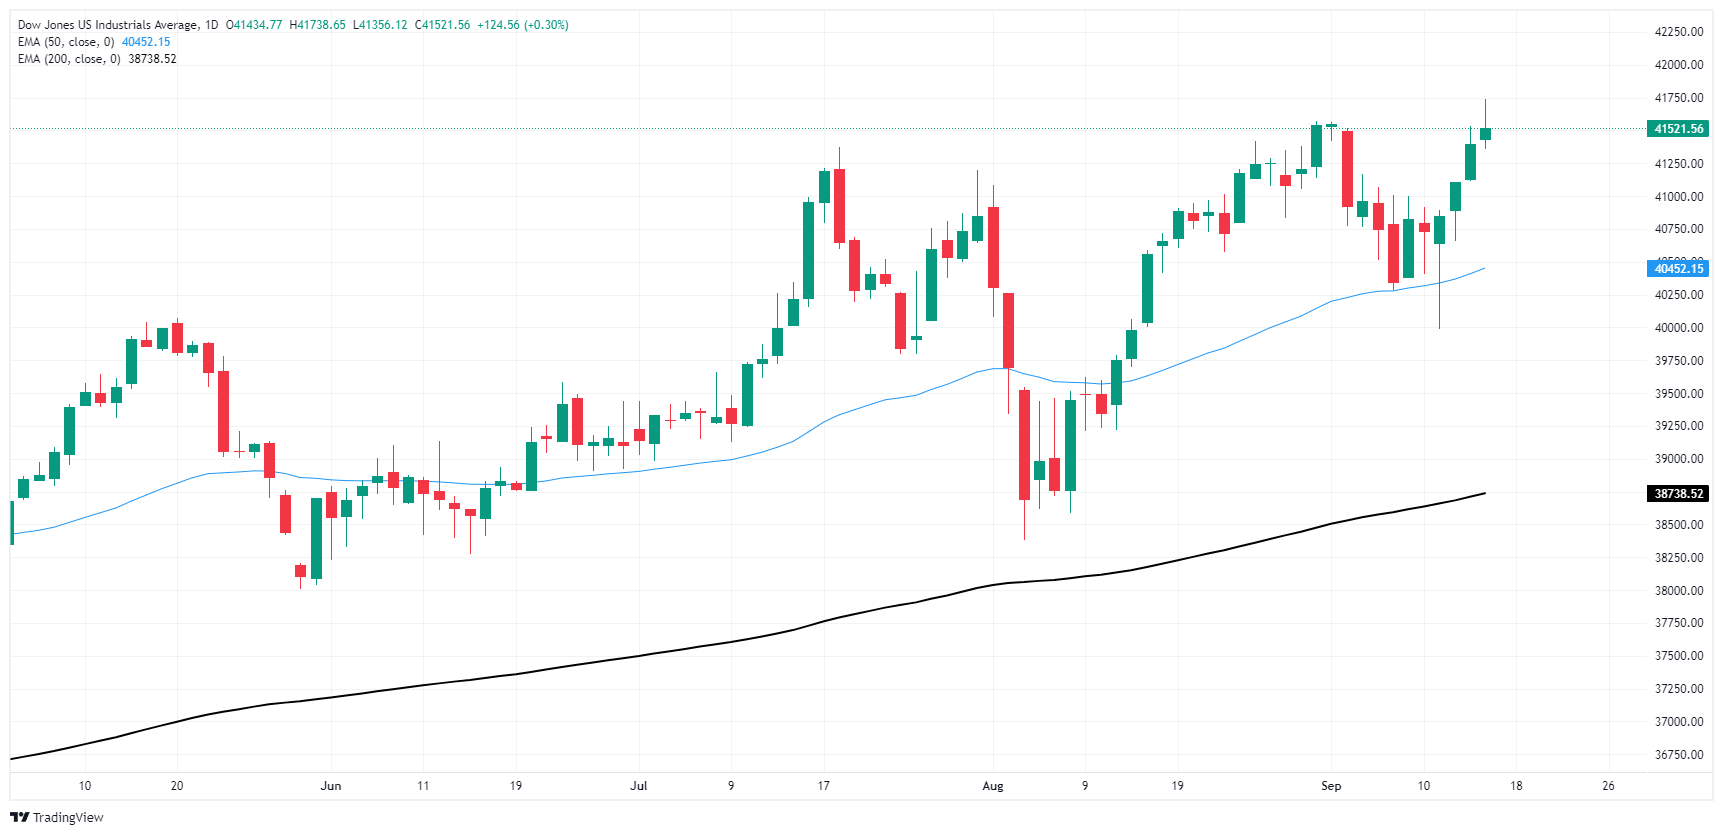
Dow Jones FAQs
The Dow Jones Industrial Average, one of the oldest stock market indices in the world, is compiled of the 30 most traded stocks in the US. The index is price-weighted rather than weighted by capitalization. It is calculated by summing the prices of the constituent stocks and dividing them by a factor, currently 0.152. The index was founded by Charles Dow, who also founded the Wall Street Journal. In later years it has been criticized for not being broadly representative enough because it only tracks 30 conglomerates, unlike broader indices such as the S&P 500.
Many different factors drive the Dow Jones Industrial Average (DJIA). The aggregate performance of the component companies revealed in quarterly company earnings reports is the main one. US and global macroeconomic data also contributes as it impacts on investor sentiment. The level of interest rates, set by the Federal Reserve (Fed), also influences the DJIA as it affects the cost of credit, on which many corporations are heavily reliant. Therefore, inflation can be a major driver as well as other metrics which impact the Fed decisions.
Dow Theory is a method for identifying the primary trend of the stock market developed by Charles Dow. A key step is to compare the direction of the Dow Jones Industrial Average (DJIA) and the Dow Jones Transportation Average (DJTA) and only follow trends where both are moving in the same direction. Volume is a confirmatory criteria. The theory uses elements of peak and trough analysis. Dow’s theory posits three trend phases: accumulation, when smart money starts buying or selling; public participation, when the wider public joins in; and distribution, when the smart money exits.
There are a number of ways to trade the DJIA. One is to use ETFs which allow investors to trade the DJIA as a single security, rather than having to buy shares in all 30 constituent companies. A leading example is the SPDR Dow Jones Industrial Average ETF (DIA). DJIA futures contracts enable traders to speculate on the future value of the index and Options provide the right, but not the obligation, to buy or sell the index at a predetermined price in the future. Mutual funds enable investors to buy a share of a diversified portfolio of DJIA stocks thus providing exposure to the overall index.
추천 기사


