
US Dollar struggles as strong NFP fails to offset tariff and fiscal risks
- The US Dollar edges lower on Friday in thin holiday trade, snapping a two-day winning streak.
- Tariff tensions resurface as Trump prepares to send letters imposing unilateral trade duties from August 1.
- US President's “One Big Beautiful Bill” passes the House of Representatives, raising long-term debt concerns.
The US Dollar (USD) eases on Friday, drifting lower in holiday-thinned trading and snapping a two-day winning streak. After climbing on the back of stronger-than-expected US Nonfarm Payrolls data released on Thursday, the Greenback is now paring gains, as market activity remains muted amid the July 4 Independence Day holiday in the United States.
The US Dollar Index (DXY), which measures the Greenback’s performance against a basket of major currencies, is edging lower during the European trading session. At the time of writing, the index is hovering near 96.90, retreating from a weekly high of 97.42 reached on Thursday following stronger-than-expected US employment data.
The pullback comes as traders weigh strong US employment figures against broader risks, including US President Donald Trump’s protectionist tariffs and heightened fiscal concerns following the passage of his massive tax-and-spending bill.
The legislation, approved by the House of Representatives on Thursday, is projected to significantly widen the budget deficit, fueling investors' anxiety over the long-term stability of US public finances. While upbeat labor market data initially lifted the US Dollar, fears surrounding protectionist trade measures and rising debt levels are now weighing on sentiment.
US President Trump has escalated tariff tensions ahead of the July 9 deadline. He announced on Thursday that he would begin sending letters to his trading partners this Friday. His intention is, as he said, to send “10 or 12” letters to key trading partners, with more to follow in the coming days, each outlining unilateral tariff rates set to come into effect on August 1. Trump also added, referring to it, “will range in value from maybe 60 or 70% tariffs to 10 and 20% tariffs,” underscoring a more aggressive protectionist stance just days ahead of the July 9 deadline.
Market Movers: Trump’s fiscal bill and rate cut repricing
- President Donald Trump’s sweeping “One Big Beautiful Bill” cleared the House of Representatives late Thursday by a narrow 218–214 margin, with two Republican lawmakers voting against it. The multi-trillion-dollar package, which includes deep tax cuts and a surge in federal spending, has intensified market concerns about the long-term trajectory of US debt. The bill is expected to be signed into law by Trump this Friday as part of Independence Day celebrations.
- The “One Big Beautiful Bill” has drawn sharp political battle lines in Washington. Republicans have hailed its passage as a major economic win and a fulfillment of the US president’s campaign promises, citing tax cuts, defense spending and enhanced border security. In contrast, Democrats unanimously opposed the legislation, warning it would deepen inequality, balloon the federal deficit, and strip millions of Americans of healthcare coverage. The partisan standoff is adding a layer of uncertainty for markets, particularly as the bill’s long-term economic impact becomes a flashpoint ahead of the 2026 midterm elections.
- Trump's bill makes 2017 tax cuts permanent and adds new tax breaks, including no federal tax on tips and deductions for overtime pay. It also raises the SALT deduction cap to $40,000 for five years. On the other hand, the bill includes deep cuts to Medicaid, making it more difficult for low-income Americans to qualify, and restricts certain types of care. It tightens rules on food stamps, cuts funding for green energy programs and sets aside over $46 billion for border security and immigration enforcement. The “One Big Beautiful Bill" also raises the US debt ceiling by $5 trillion.
- The nonpartisan Congressional Budget Office (CBO) estimates that the newly passed fiscal bill will add $3.4 trillion to US deficits over the next ten years. The national debt-to-GDP ratio is now projected to climb from 97.8% to over 125% well above the CBO’s earlier forecast of 117.1% issued in January.
- The Nonfarm Payrolls (NFP) data released on Thursday showed that the US economy added 147,000 jobs in June, exceeding market expectations and lowering the US Unemployment Rate to 4.1%. While hiring in the private sector was slower, the overall strength of the report led traders to dial back expectations of an interest rate cut by the Federal Reserve (Fed) in July. According to the CME FedWatch Tool, the odds of a cut have plunged from around 24% to just 4.7% following the report. Fed Chair Jerome Powell has repeated that the central bank will wait for more signs of cooling in both jobs and inflation before making a move.
- US Treasury Secretary Scott Bessent sharpened his criticism of the Fed on Thursday, stating that the FOMC is “a little off” in its judgment by holding rates steady despite what he called “very high real rates.” Bessent added, “If they don’t cut now, the cut in September might have to be bigger.” Despite the hawkish tone from the Fed, futures markets are leaning dovish, pricing in an 80% chance of a 25-basis-points (bps) rate cut in September and a total of 50bps in easing by the end of 2025.
DXY Technical outlook: Wedge breakdown holds as US Dollar fails to reclaim 97.00
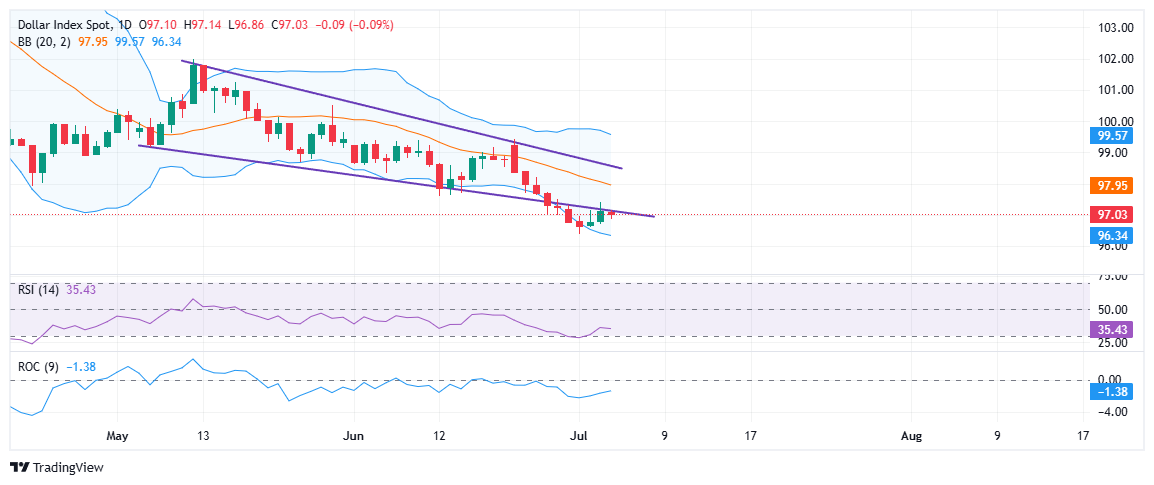
The US Dollar Index (DXY) broke below a descending wedge pattern earlier this week. The index attempted to reclaim the 97.00 mark on Thursday following stronger-than-expected Nonfarm Payrolls data but failed to hold above it. The bounce stalled right at the broken wedge support, which has now turned into resistance. This failed retest reinforces the bearish setup, as DXY edges lower during Friday’s trading session, trading just below the 97.00 threshold.
The price is also sitting below the 20-day moving average, which also serves as the middle Bollinger Band, indicating that upside momentum remains weak. Unless bulls manage a clean breakout above this zone near 97.00–97.20, the broader bearish trend is likely to stay in place.
Momentum indicators also reflect a cautious tone. The Relative Strength Index (RSI) is hovering just above 34, staying in bearish territory but showing early signs of stabilization. Meanwhile, the Rate of Change (ROC) remains negative, indicating selling pressure is still present, though not accelerating.
If the DXY breaks below its immediate support near 96.30, the lower Bollinger Band, it could open the door to a fresh downside move targeting 95.00. On the other hand, a strong close above the wedge could spark a short-term recovery, but for now, the US Dollar remains under pressure.
US Dollar PRICE Today
The table below shows the percentage change of US Dollar (USD) against listed major currencies today. US Dollar was the strongest against the Australian Dollar.
| USD | EUR | GBP | JPY | CAD | AUD | NZD | CHF | |
|---|---|---|---|---|---|---|---|---|
| USD | -0.04% | 0.09% | -0.36% | 0.08% | 0.38% | 0.19% | -0.12% | |
| EUR | 0.04% | 0.17% | -0.31% | 0.15% | 0.30% | 0.22% | -0.02% | |
| GBP | -0.09% | -0.17% | -0.45% | 0.00% | 0.16% | 0.07% | -0.20% | |
| JPY | 0.36% | 0.31% | 0.45% | 0.46% | 0.62% | 0.49% | 0.15% | |
| CAD | -0.08% | -0.15% | -0.00% | -0.46% | 0.14% | 0.07% | -0.20% | |
| AUD | -0.38% | -0.30% | -0.16% | -0.62% | -0.14% | -0.13% | -0.36% | |
| NZD | -0.19% | -0.22% | -0.07% | -0.49% | -0.07% | 0.13% | -0.27% | |
| CHF | 0.12% | 0.02% | 0.20% | -0.15% | 0.20% | 0.36% | 0.27% |
The heat map shows percentage changes of major currencies against each other. The base currency is picked from the left column, while the quote currency is picked from the top row. For example, if you pick the US Dollar from the left column and move along the horizontal line to the Japanese Yen, the percentage change displayed in the box will represent USD (base)/JPY (quote).
추천 기사


