

Dow Jones Industrial Average extends backslide as stocks weaken ahead of stale data
- The Dow Jones slipped another 220 points, falling below 47,000.
- Stocks are taking a further hit as questions about the AI sector continue to swirl.
- Backdated US data on labor and inflation comes this week as investors weigh Fed rate cut chances.
The Dow Jones Industrial Average (DJIA) hit another weak patch on Monday, backsliding around 270 points and slipping back below the 47,000 handle to start the new trading week with many of the same questions from last week going unanswered. The AI segment continues to see new challenges amid concerns about endpoint revenues, and investors are hoping that a kickstart to official data sources following the reopening of the federal government will help push the Federal Reserve (Fed) to deliver a third straight interest rate cut in December.
Alphabet shares supported by Berkshire investment
Shares in Google parent holding company Alphabet (GOOG) rose over 3% on the day after it was revealed that Warren Buffett’s Berkshire Hathaway (BRK) poured $4.3 billion into a stake in the Google search and YouTube giant at the end of September. Hyper-traditionalist investor Warren Buffett recently announced his retirement by the end of the year to Berkshire shareholders, leading to speculation that a play into Google properties is being spearheaded by more tech-friendly names in the Berkshire flagship.
Berkshire Hathaway continues to unwind its massive holdings of Apple (AAPL) stock, shedding another 15% of its total shares held as of the end of the third quarter. However, the Oracle of Omaha’s investment company’s holdings in Apple still sit at a lofty $60.7 billion.
Too-hot AI rally now faces tough questions about profitability
The AI trade continues to come under renewed pressure, with LLM computing services darling Nvidia (NVDA) falling another 1.8% on Monday. The chipmaker is slated to reveal its latest quarterly earnings after the closing bell on Wednesday, and investors are becoming concerned that the constantly-growing demand for AI-driven compute power still remains woefully outsized compared to revenues and return on investment on the actual deployment side.
US government back open... for now
The US government successfully passed a short-term funding resolution to restart federal operations last week, and investors are immediately pivoting into a wait-and-see stance as backdated labor and inflation data come down the chute. The Trump administration has preemptively warned that October’s labor and inflation data may be “lost forever”, but traders are hoping that September’s Nonfarm Payrolls (NFP) jobs report, while stale, will provide enough ammunition to pave the way to a third straight interest rate cut on December 10.
Fed Chair Jerome Powell signaled at the Fed’s last interest rate decision that a lack of official government data will force the Fed to stand pat until it receives further information on the US economy, battering broad-market expectations for a third straight rate cut in December.
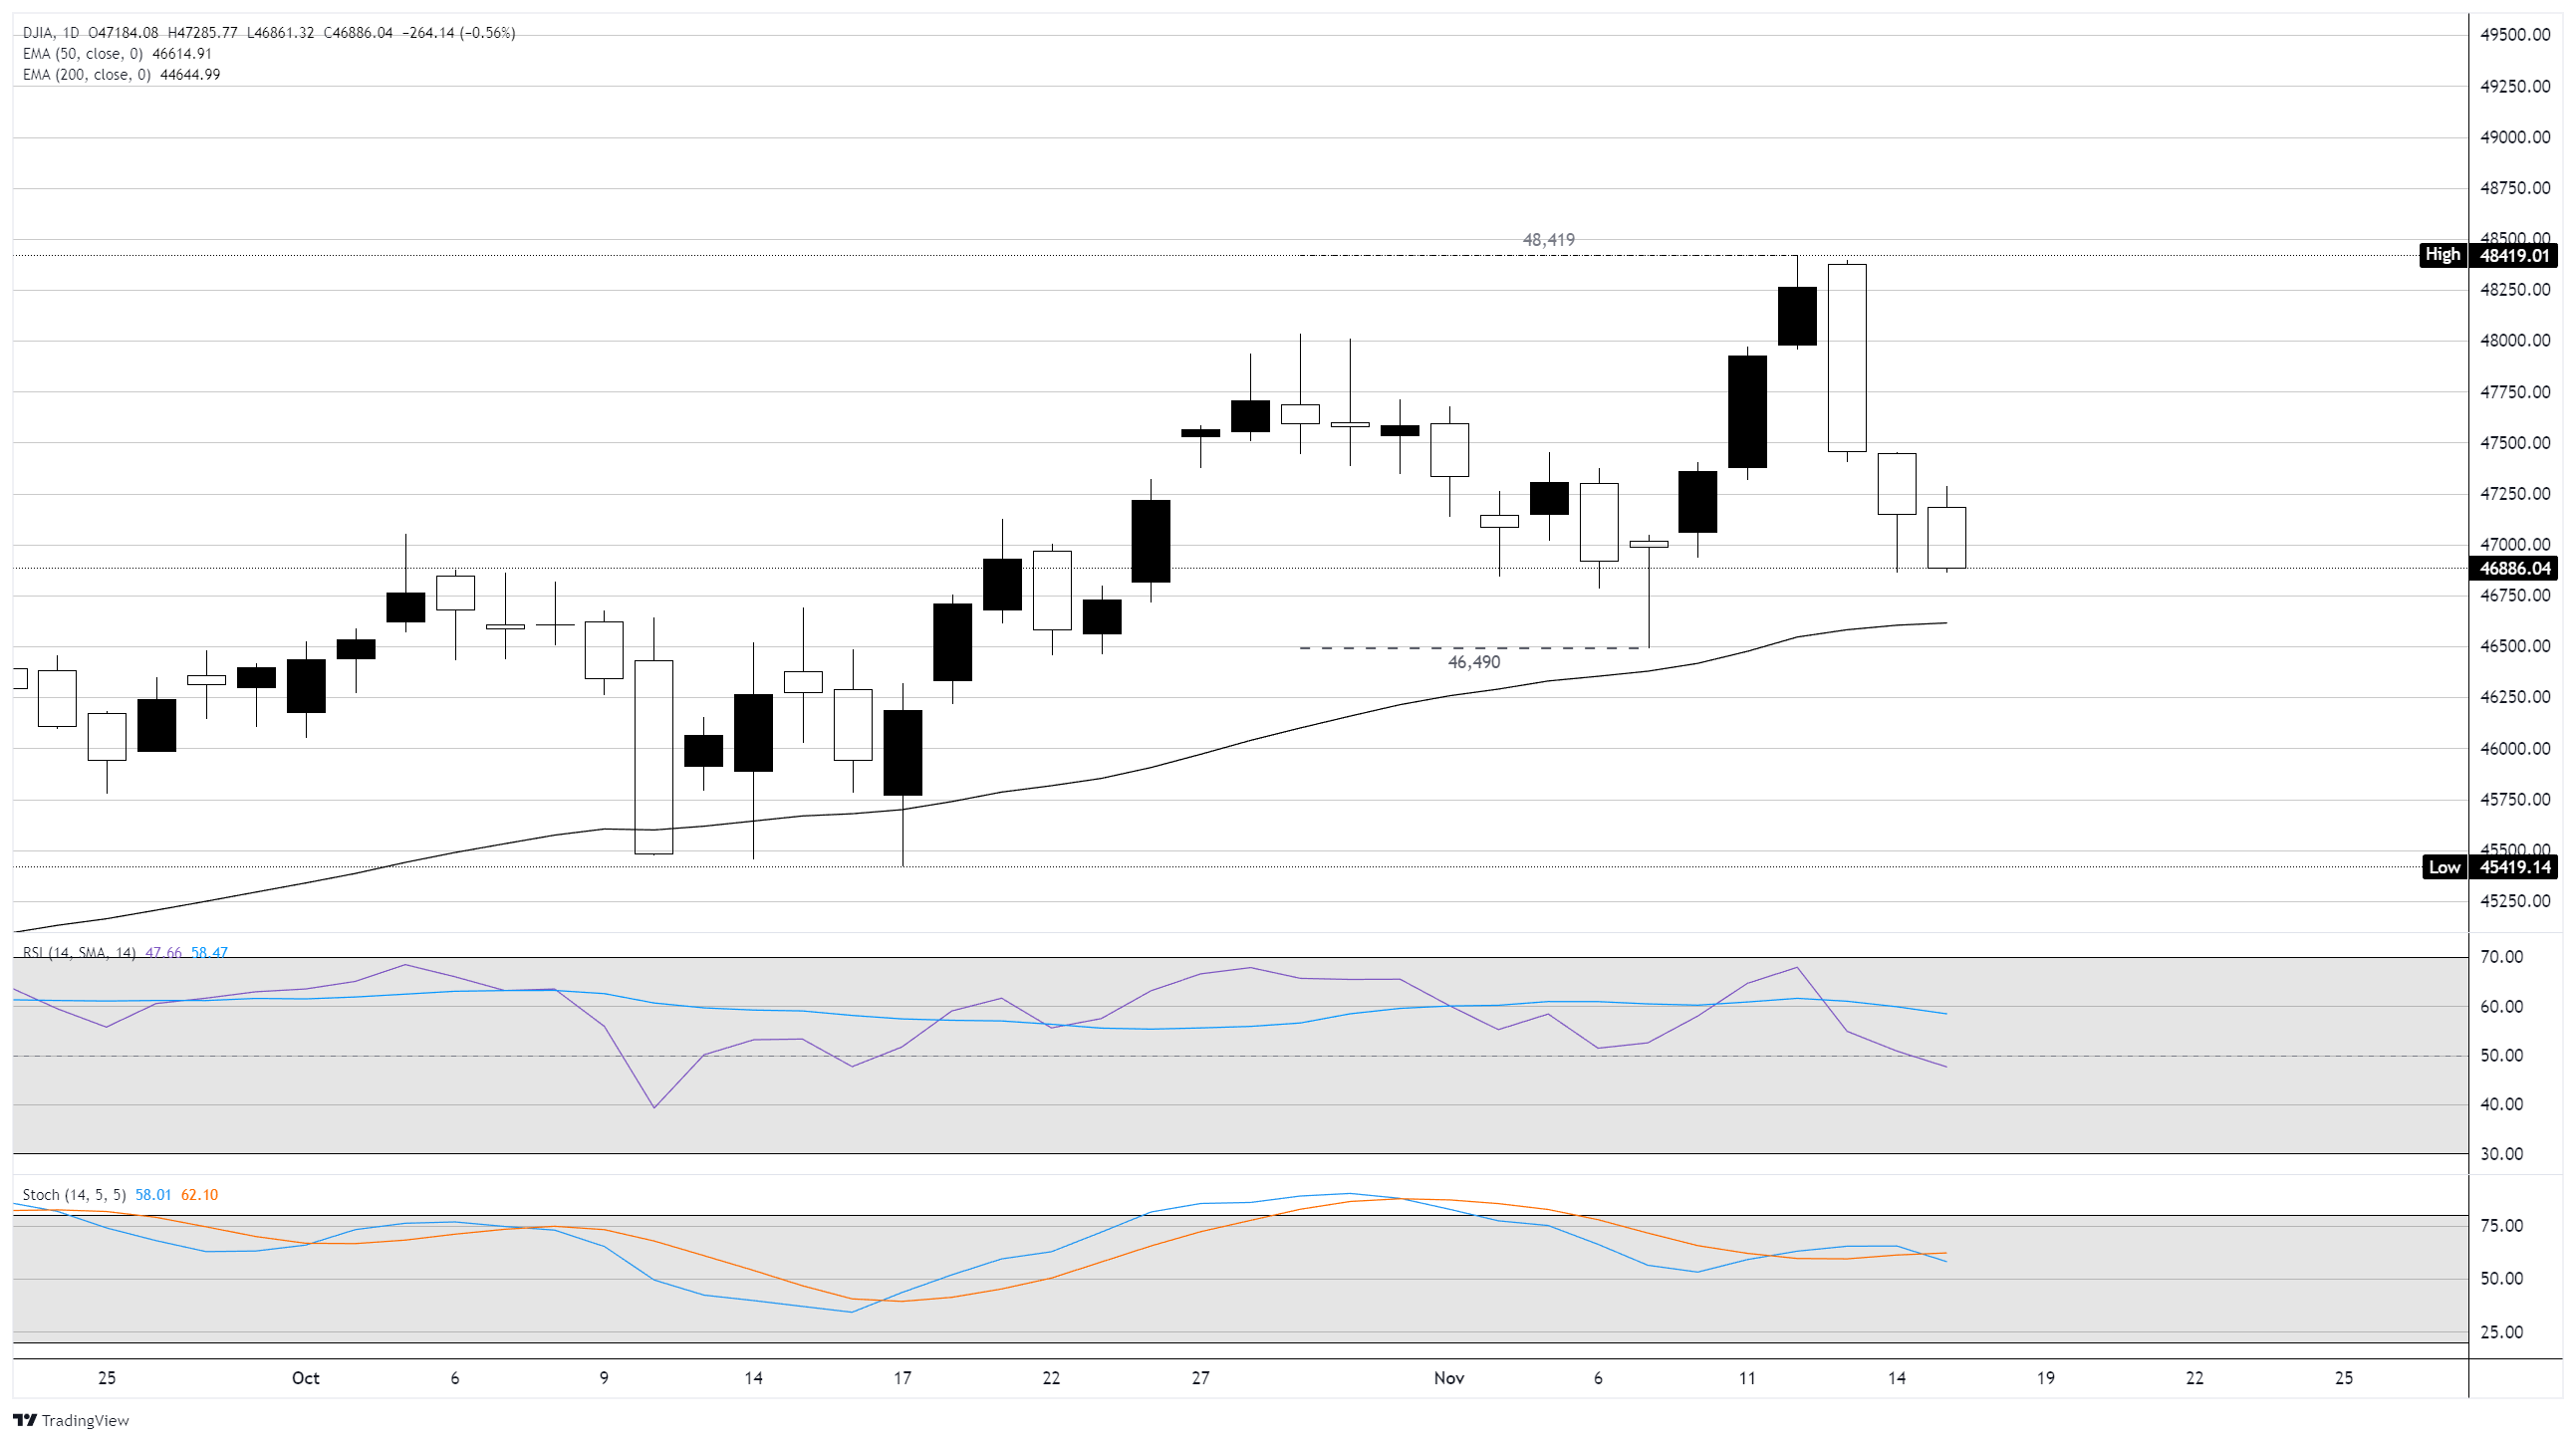
Dow Jones daily chart
Dow Jones FAQs
The Dow Jones Industrial Average, one of the oldest stock market indices in the world, is compiled of the 30 most traded stocks in the US. The index is price-weighted rather than weighted by capitalization. It is calculated by summing the prices of the constituent stocks and dividing them by a factor, currently 0.152. The index was founded by Charles Dow, who also founded the Wall Street Journal. In later years it has been criticized for not being broadly representative enough because it only tracks 30 conglomerates, unlike broader indices such as the S&P 500.
Many different factors drive the Dow Jones Industrial Average (DJIA). The aggregate performance of the component companies revealed in quarterly company earnings reports is the main one. US and global macroeconomic data also contributes as it impacts on investor sentiment. The level of interest rates, set by the Federal Reserve (Fed), also influences the DJIA as it affects the cost of credit, on which many corporations are heavily reliant. Therefore, inflation can be a major driver as well as other metrics which impact the Fed decisions.
Dow Theory is a method for identifying the primary trend of the stock market developed by Charles Dow. A key step is to compare the direction of the Dow Jones Industrial Average (DJIA) and the Dow Jones Transportation Average (DJTA) and only follow trends where both are moving in the same direction. Volume is a confirmatory criteria. The theory uses elements of peak and trough analysis. Dow’s theory posits three trend phases: accumulation, when smart money starts buying or selling; public participation, when the wider public joins in; and distribution, when the smart money exits.
There are a number of ways to trade the DJIA. One is to use ETFs which allow investors to trade the DJIA as a single security, rather than having to buy shares in all 30 constituent companies. A leading example is the SPDR Dow Jones Industrial Average ETF (DIA). DJIA futures contracts enable traders to speculate on the future value of the index and Options provide the right, but not the obligation, to buy or sell the index at a predetermined price in the future. Mutual funds enable investors to buy a share of a diversified portfolio of DJIA stocks thus providing exposure to the overall index.
추천 기사


