

Bitcoin Price Forecast: BTC climbs near $69,000 as ETF inflows return, war tensions ease
- Bitcoin price extends gains, trading above $69,000 on Wednesday after finding support around a key technical level.
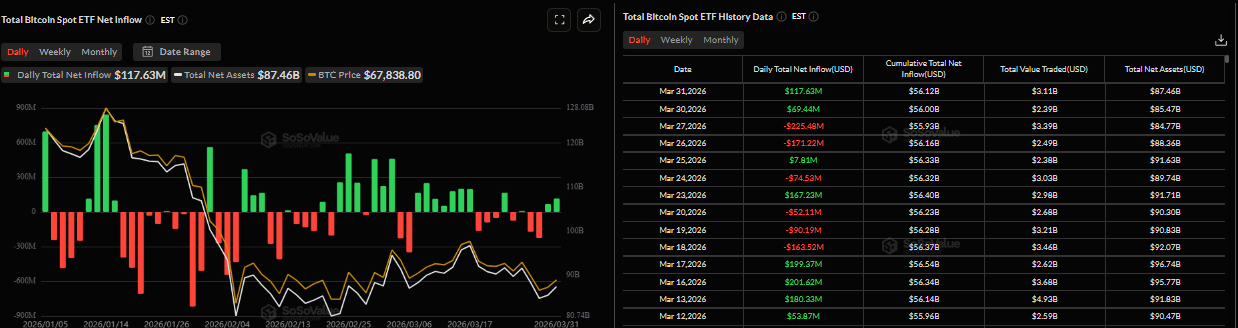
- US-listed spot ETF recorded an inflow of $117.63 million on Tuesday, marking the second consecutive day of positive flows this week.
- Risk appetite improves as the Middle East conflict eases, supporting a broader risk-on sentiment across markets.
Bitcoin (BTC) price extends recovery trading near $69,000 on Wednesday after rebounding from a key technical level earlier this week. Institutional demand shows early signs of a comeback as spot Exchange Traded Funds (ETFs) record two positive inflows this week. Meanwhile, easing tensions in the Middle East war support a broader risk-on sentiment, which could extend further recovery in the Crypto King.
Easing war tension boosts risk appetite
Bitcoin extends its ongoing recovery, reaching a high of $69,310 during the European trading session on Wednesday as sentiment around the US-Iran war continues to improve.
Iran’s President Masoud Pezeshkian told European Union (EU) Council President António Costa on Tuesday that his country is ready to end the war with the US. Still, the country needs certain guarantees, especially no repetition of aggression, the Iranian state news agency reported.
This news came in following the announcement that the US President Donald Trump is willing to end the war with Iran despite the Strait of Hormuz remaining closed, as Washington doesn’t intend to stretch the military mission beyond his timeline of four to six weeks. Trump said that he will pursue a diplomatic way to reopen waterways.
These developments have boosted risk-on sentiment, with US equities extending their recovery and risk-sensitive assets such as Bitcoin gaining further ground, while the West Texas Intermediate (WTI) Crude Oil price pulls back.
Institutional demand shows early signs of a comeback
Institutional demand shows mild signs of a comeback. SoSoValue data shows that Bitcoin spot ETFs recorded an inflow of $117.63 million on Tuesday, marking the second consecutive day of positive flows this week. If these inflows continue and intensify, BTC could see a further rally ahead.
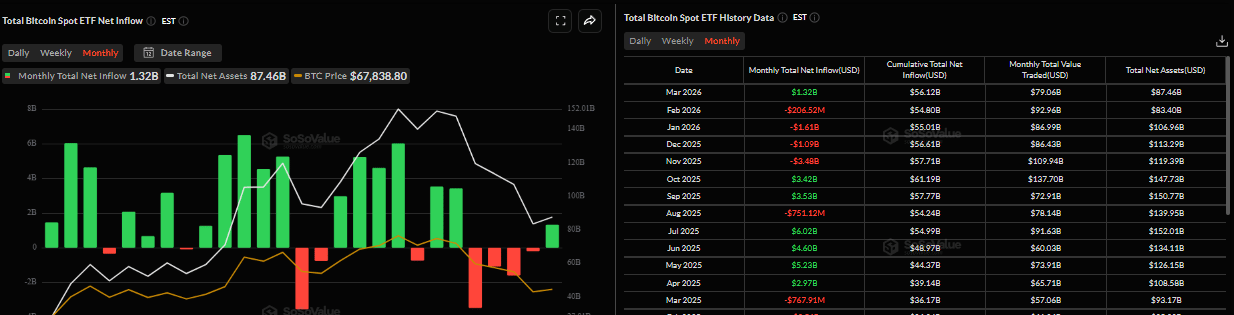
In addition, the monthly chart shows that ETF inflows in March totaled $1.32 billion, breaking four consecutive months of withdrawals and highlighting the comeback in institutional demand.
What’s there for BTC in April?
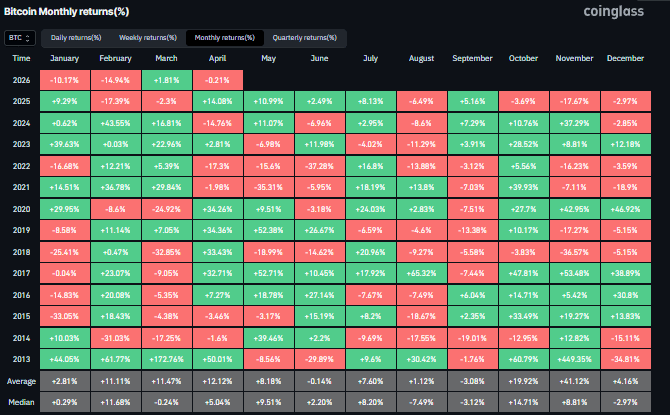
Bitcoin price closed March with a slight positive return of 1.81%, breaking its two consecutive monthly declines at the start of the year and its fifth consecutive month of correction since October 2025, as shown in the chart below.
However, monthly trends suggest some signs of optimism. Historically, Bitcoin has delivered positive returns in April, averaging gains of 12.12%. This recovery thesis would play in if institutional inflows resume, regulatory developments (such as the Clarity Act) turn supportive for the broader crypto market, and the war in the Middle East comes to an end, which could restore investor confidence and risk appetite.
Bitcoin Price Forecast: BTC nears midpoint of the consolidation range
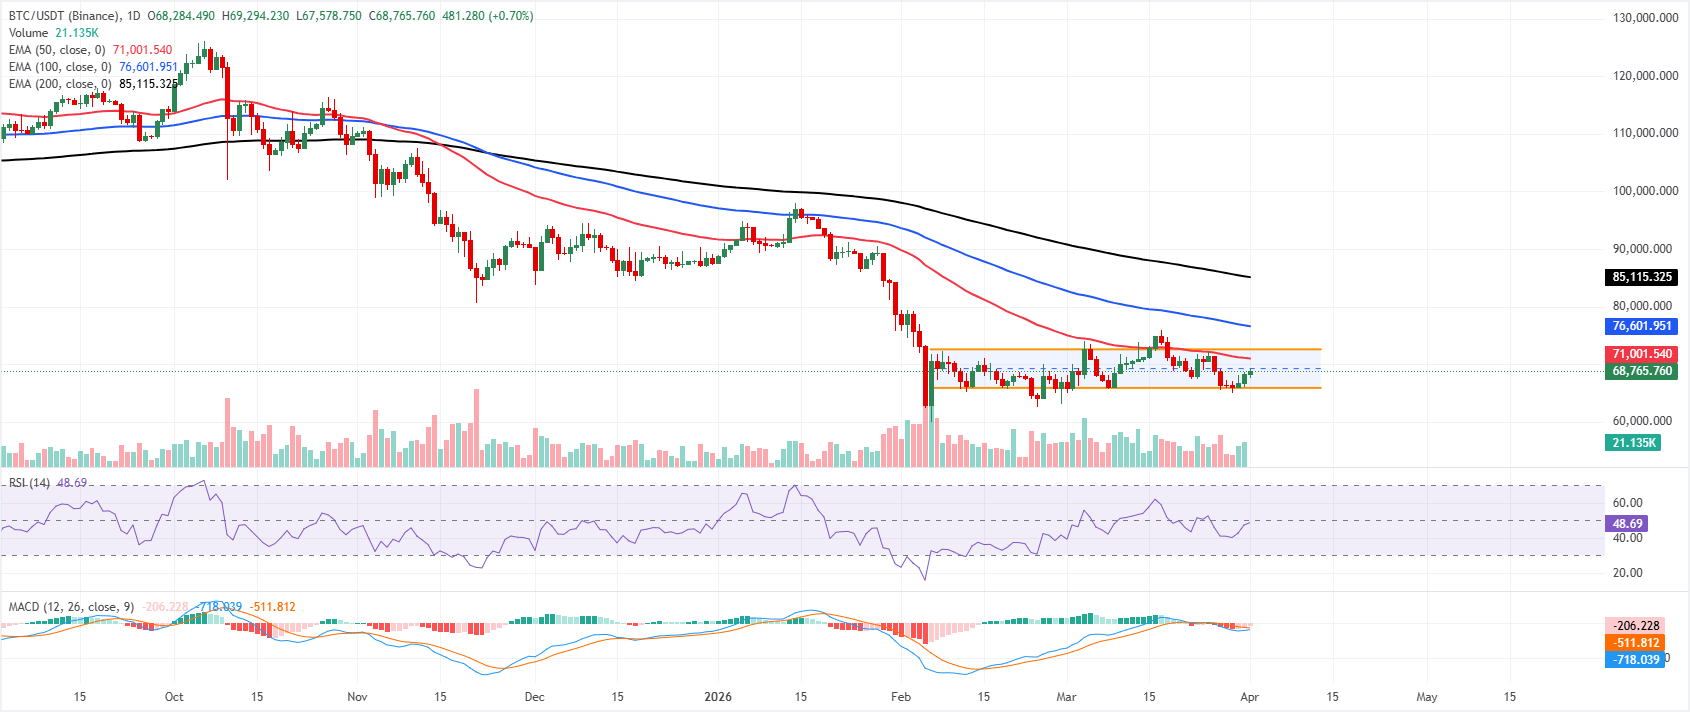
Bitcoin price is trading above $68,700 at the time of writing on Wednesday after rebounding from a key support zone earlier this week. Price holds within a parallel channel, trading closer to the mid-band at $69,200 after failing to extend above the upper boundary near $72,600, which preserves a near-term bearish bias within an already corrective structure.
The cluster of 50-day, 100-day and 200-day Exponential Moving Averages (EMAs) well above the current trading price underscores a downside-skewed backdrop, with the 50-day EMA near $71,000 acting as the first dynamic cap on rebounds.
Momentum readings stay soft, with the Relative Strength Index (RSI) on the daily chart at 48 just below the 50 line and reflecting subdued upside momentum. In contrast, the Moving Average Convergence Divergence (MACD) indicator remains below zero despite a contracting negative histogram, suggesting fading but still dominant selling pressure.
Initial resistance emerges near the midpoint of the channel, around $69,200, just ahead of the channel top near $72,600, where the consolidating boundary tops converge with the 50-day EMA to form a key barrier; a daily close above this zone would be needed to challenge the 100-day EMA around $76,600 next.
On the downside, immediate support emerges near the channel floor at $65,900, safeguarding the recent series of lower lows. A break below this level would expose follow-through toward the next downside attraction around $64,000. As long as BTC holds beneath $70,000–$72,600, rallies are vulnerable to selling into strength, keeping the short-term bias tilted to the downside within the broader consolidation.
(The technical analysis of this story was written with the help of an AI tool.)
Bitcoin, altcoins, stablecoins FAQs
Bitcoin is the largest cryptocurrency by market capitalization, a virtual currency designed to serve as money. This form of payment cannot be controlled by any one person, group, or entity, which eliminates the need for third-party participation during financial transactions.
Altcoins are any cryptocurrency apart from Bitcoin, but some also regard Ethereum as a non-altcoin because it is from these two cryptocurrencies that forking happens. If this is true, then Litecoin is the first altcoin, forked from the Bitcoin protocol and, therefore, an “improved” version of it.
Stablecoins are cryptocurrencies designed to have a stable price, with their value backed by a reserve of the asset it represents. To achieve this, the value of any one stablecoin is pegged to a commodity or financial instrument, such as the US Dollar (USD), with its supply regulated by an algorithm or demand. The main goal of stablecoins is to provide an on/off-ramp for investors willing to trade and invest in cryptocurrencies. Stablecoins also allow investors to store value since cryptocurrencies, in general, are subject to volatility.
Bitcoin dominance is the ratio of Bitcoin's market capitalization to the total market capitalization of all cryptocurrencies combined. It provides a clear picture of Bitcoin’s interest among investors. A high BTC dominance typically happens before and during a bull run, in which investors resort to investing in relatively stable and high market capitalization cryptocurrency like Bitcoin. A drop in BTC dominance usually means that investors are moving their capital and/or profits to altcoins in a quest for higher returns, which usually triggers an explosion of altcoin rallies.
추천 기사


