


SUI Price Forecast: SUI nears $4 breakout after double-digit surge
- SUI edges higher, posting double-digit gains on Monday and inching closer to the $4 mark.
- The DeFi Total Value Locked of SUI hits a record high of $2.20 billion, indicating increased network activity.
- Rising optimism around SUI fuels its Open Interest to $1.73 billion.
Sui (SUI) appreciates nearly 12% at press time on Monday, approaching closer towards the $4 milestone and a crucial overhead resistance. The SUI rally could have been fueled by its Total Value Locked (TVL) on the decentralized finance (DeFi) network hitting a record high of $2.20 billion, and the Open Interest reaching $1.73 billion.
The technical outlook suggests that a dominant bullish bias targets the $4 breakout for extended gains.
Sui TVL hits record high of $2.20 billion
In the DeFi space, the Total Value Locked refers to the US Dollar (USD) value of digital assets stored on a network. Typically, an increase in TVL is associated with heightened DeFi activity on a network.
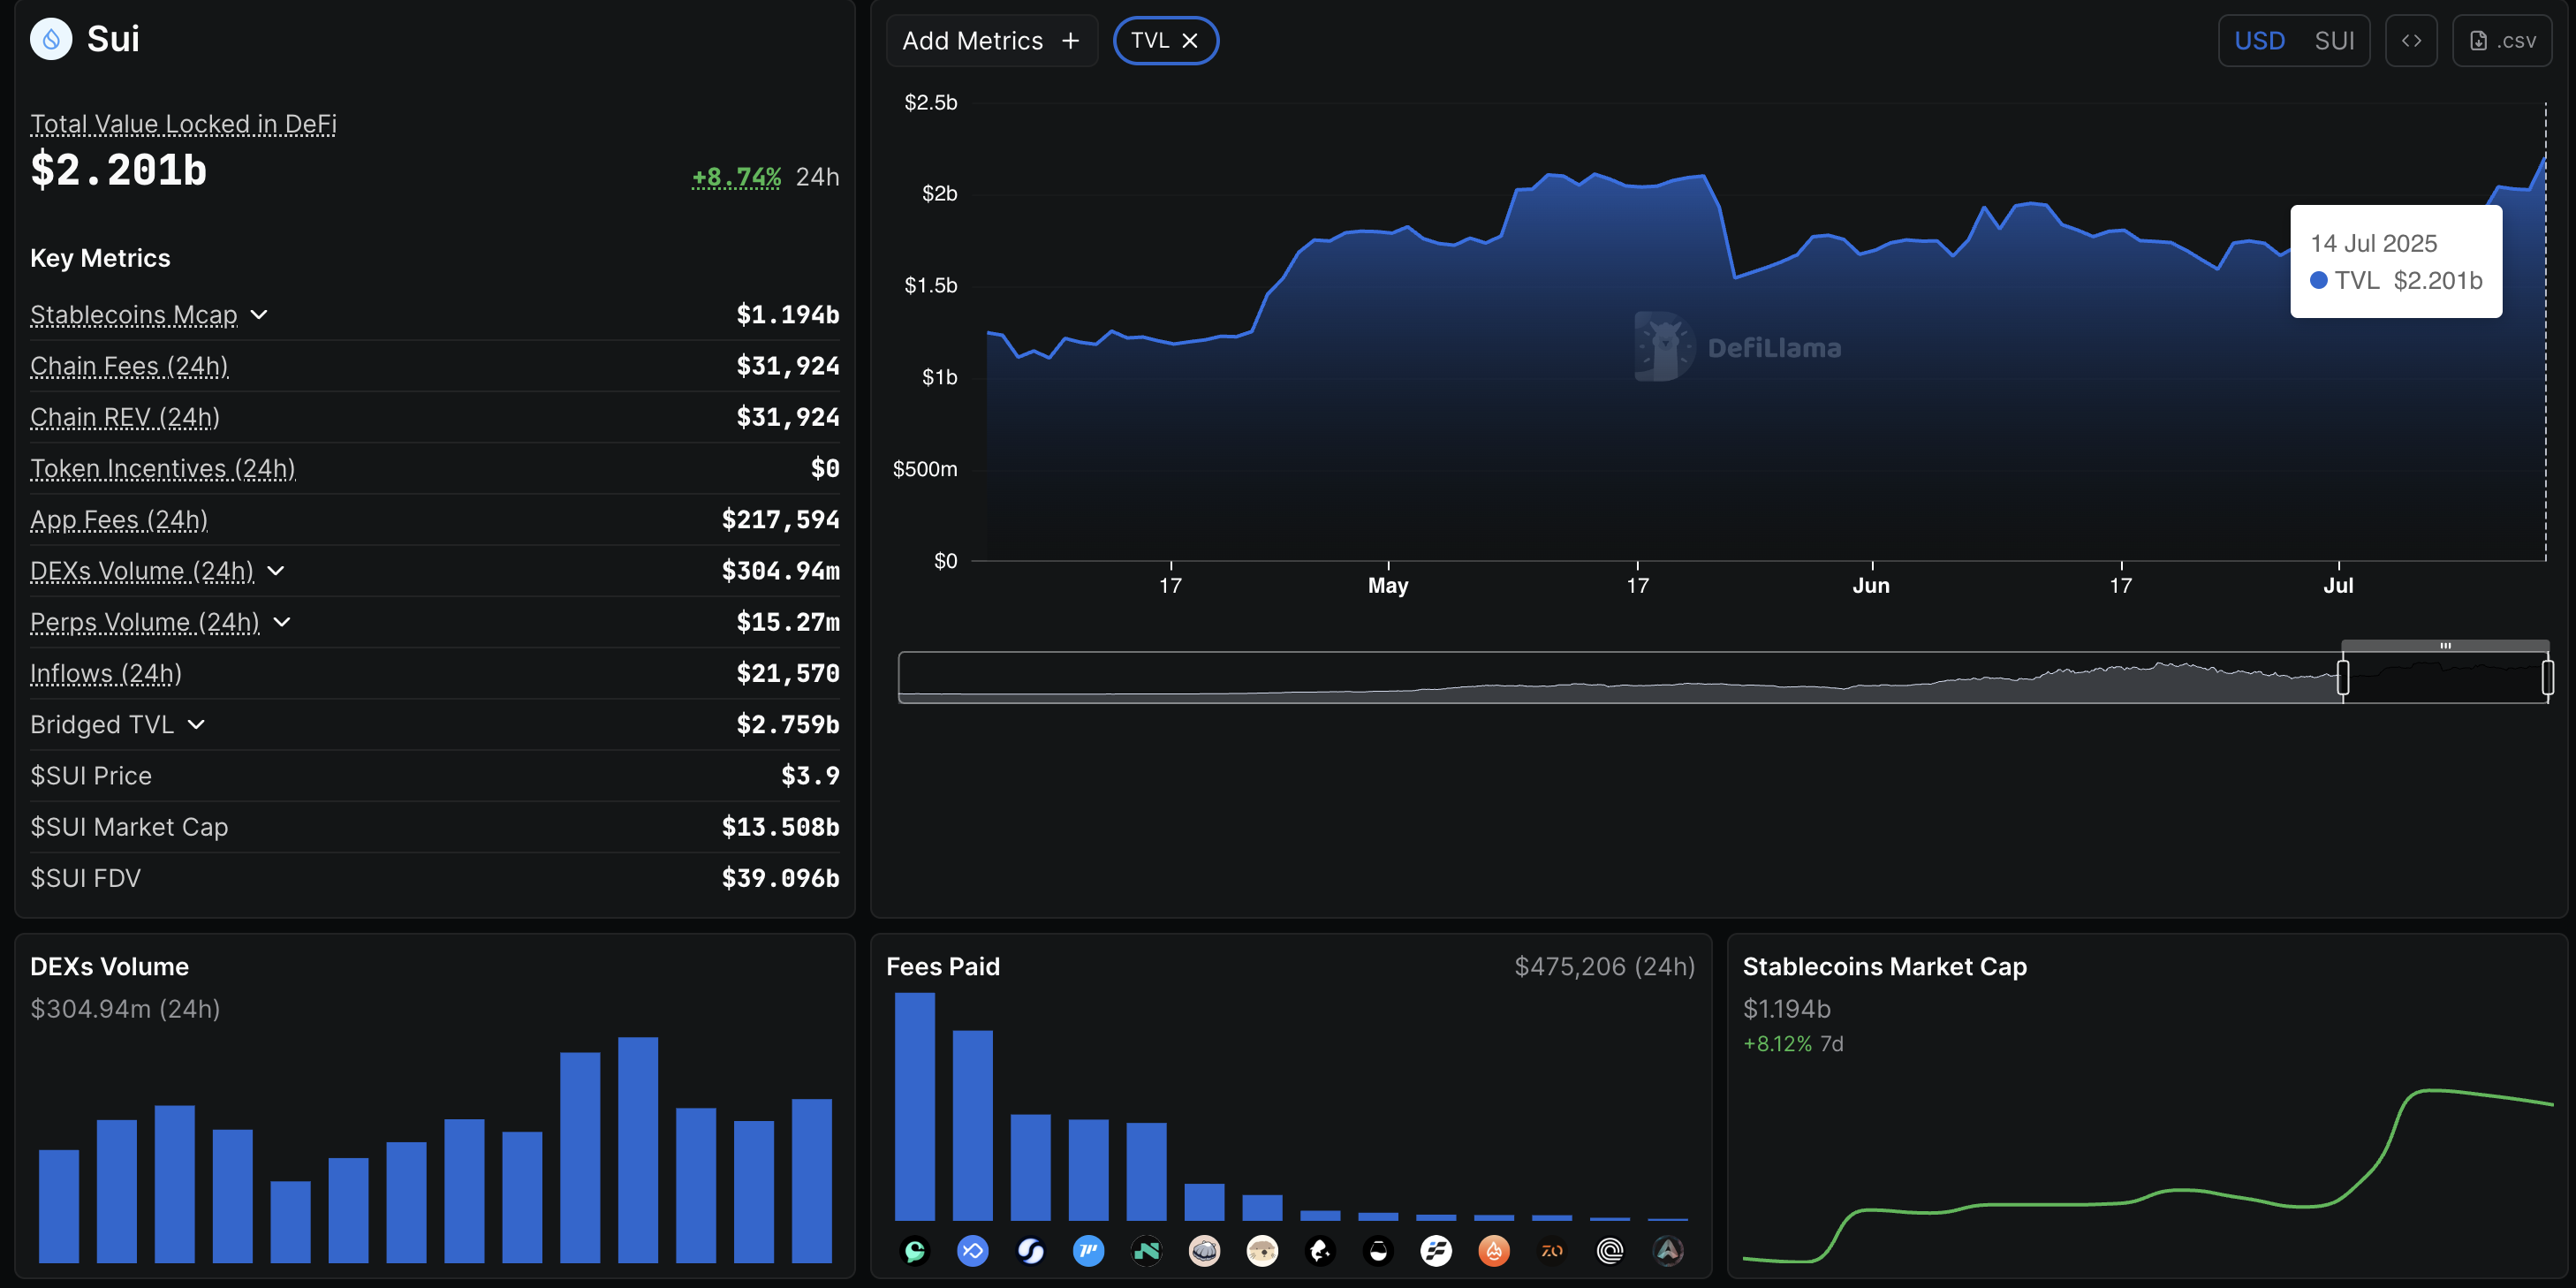
Sui TVL. Source: DeFiLlama
DeFiLlama data shows the Sui TVL hits $2.20 billion on Monday, an 8.74% surge in the last 24 hours.
Open Interest surge points to increased traders’ optimism
CoinGlass data shows a 19.10% increase in SUI Open Interest (OI) in the last 24 hours, reaching $1.73 billion. A spike in OI translates to increased buying in the derivatives market as traders anticipate further gains.
Adding credence to increased buying activity, the OI-weighted funding rate at 0.01% indicates a bullish bias. Bulls pay the positive rates to negate the imbalance in swap and spot prices.
The short-term rally wipes out $8.02 million worth of short positions in the last 24 hours compared to $1.47 million of longs, increasing active bullish positions. However, the long/short ratio marginally crosses the threshold of 1, suggesting an almost equal number of counterparty positions.
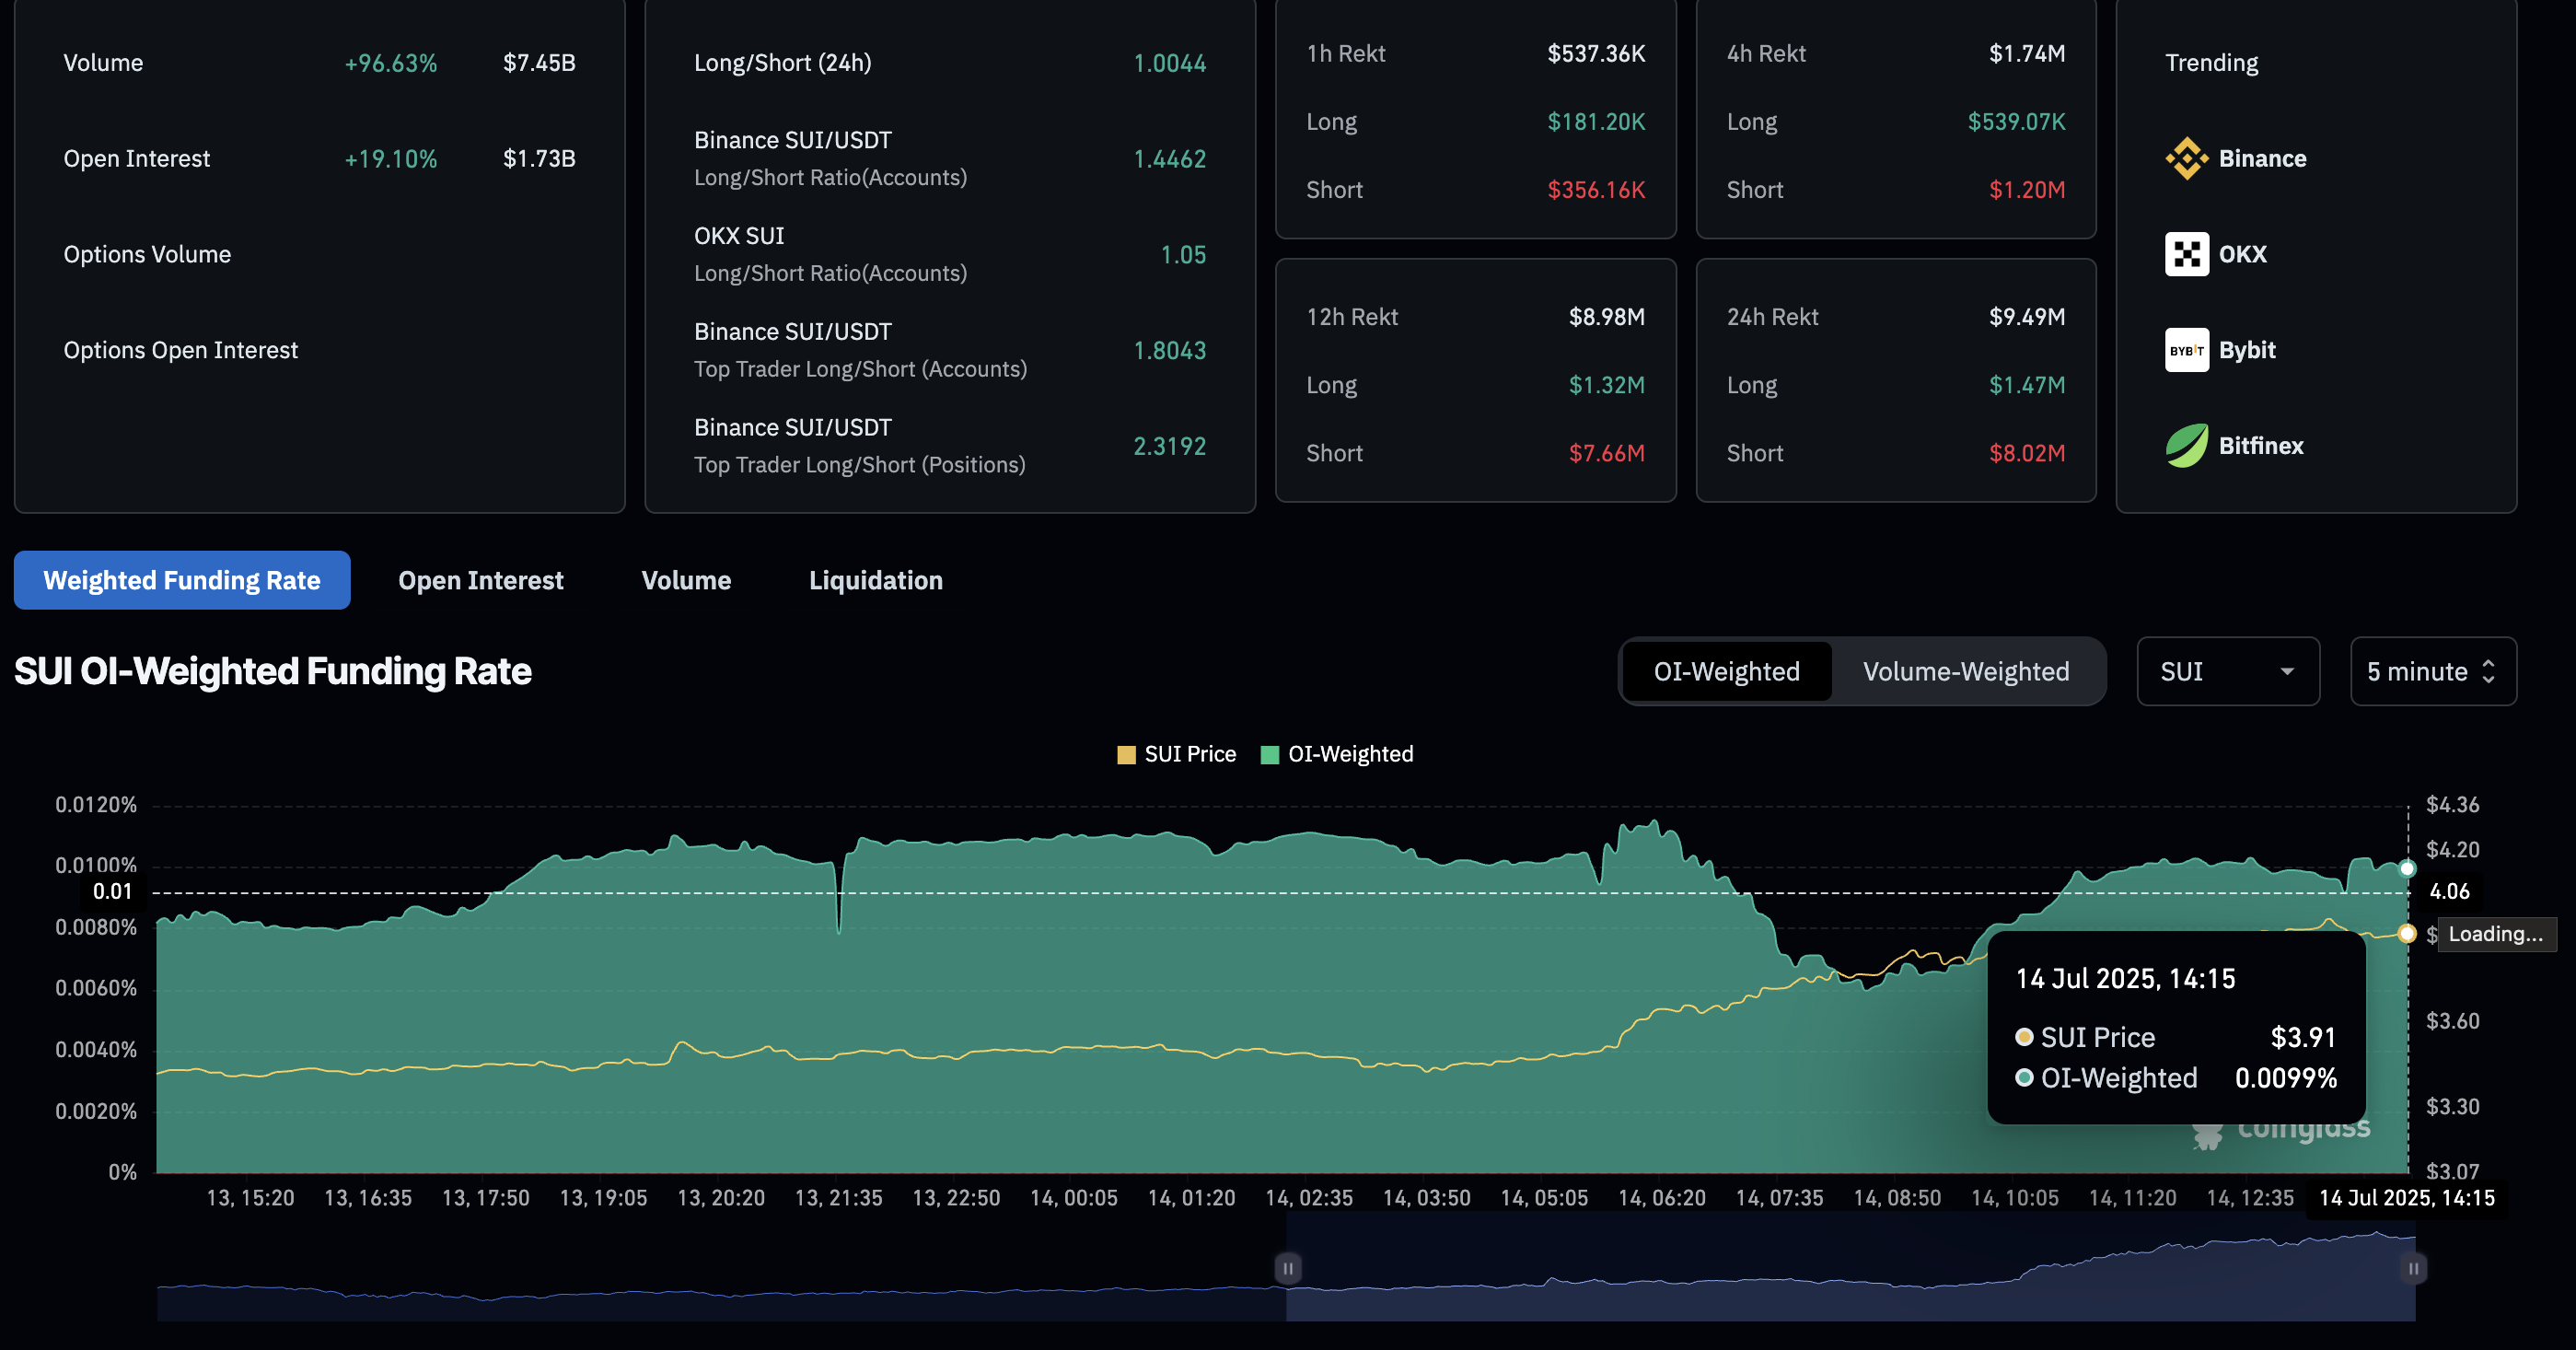
Sui Derivatives. Source: Coinglass
SUI nears $4 breakout, targeting $5.36
Sui exceeded a resistance trendline formed by connecting the May 12 and June 10 peaks, with the nearly 20% rise last week. At the time of writing, SUI adds almost 12% to the previous week's gains, nearing the $4 level breakout.
A potential daily close above the $4 mark would increase the chances of SUI reaching the 78.6% Fibonacci level at $4.20, drawn from the January 6 peak at $5.36 to the April 7 bottom of $1.71. In case SUI extends beyond $4.20, it could rise towards the $5.36 peak.
The altcoin’s bounce off from under the 200-day Exponential Moving Average (EMA) at $3.03 avoids a death cross between the 50-day and 200-day EMAs. With the uptick, the 50-day EMA inches closer to crossing above the 100-day EMA, triggering a bullish crossover. Typically, investors consider this a buying opportunity, while the EMAs could act as support levels in case of a sudden trend reversal.
The Money Flow Index (MFI) reads 78, indicating increased money inflow in Sui based on the price and volume data. Meanwhile, the Stochastic RSI shows the average lines in the overbought zone.
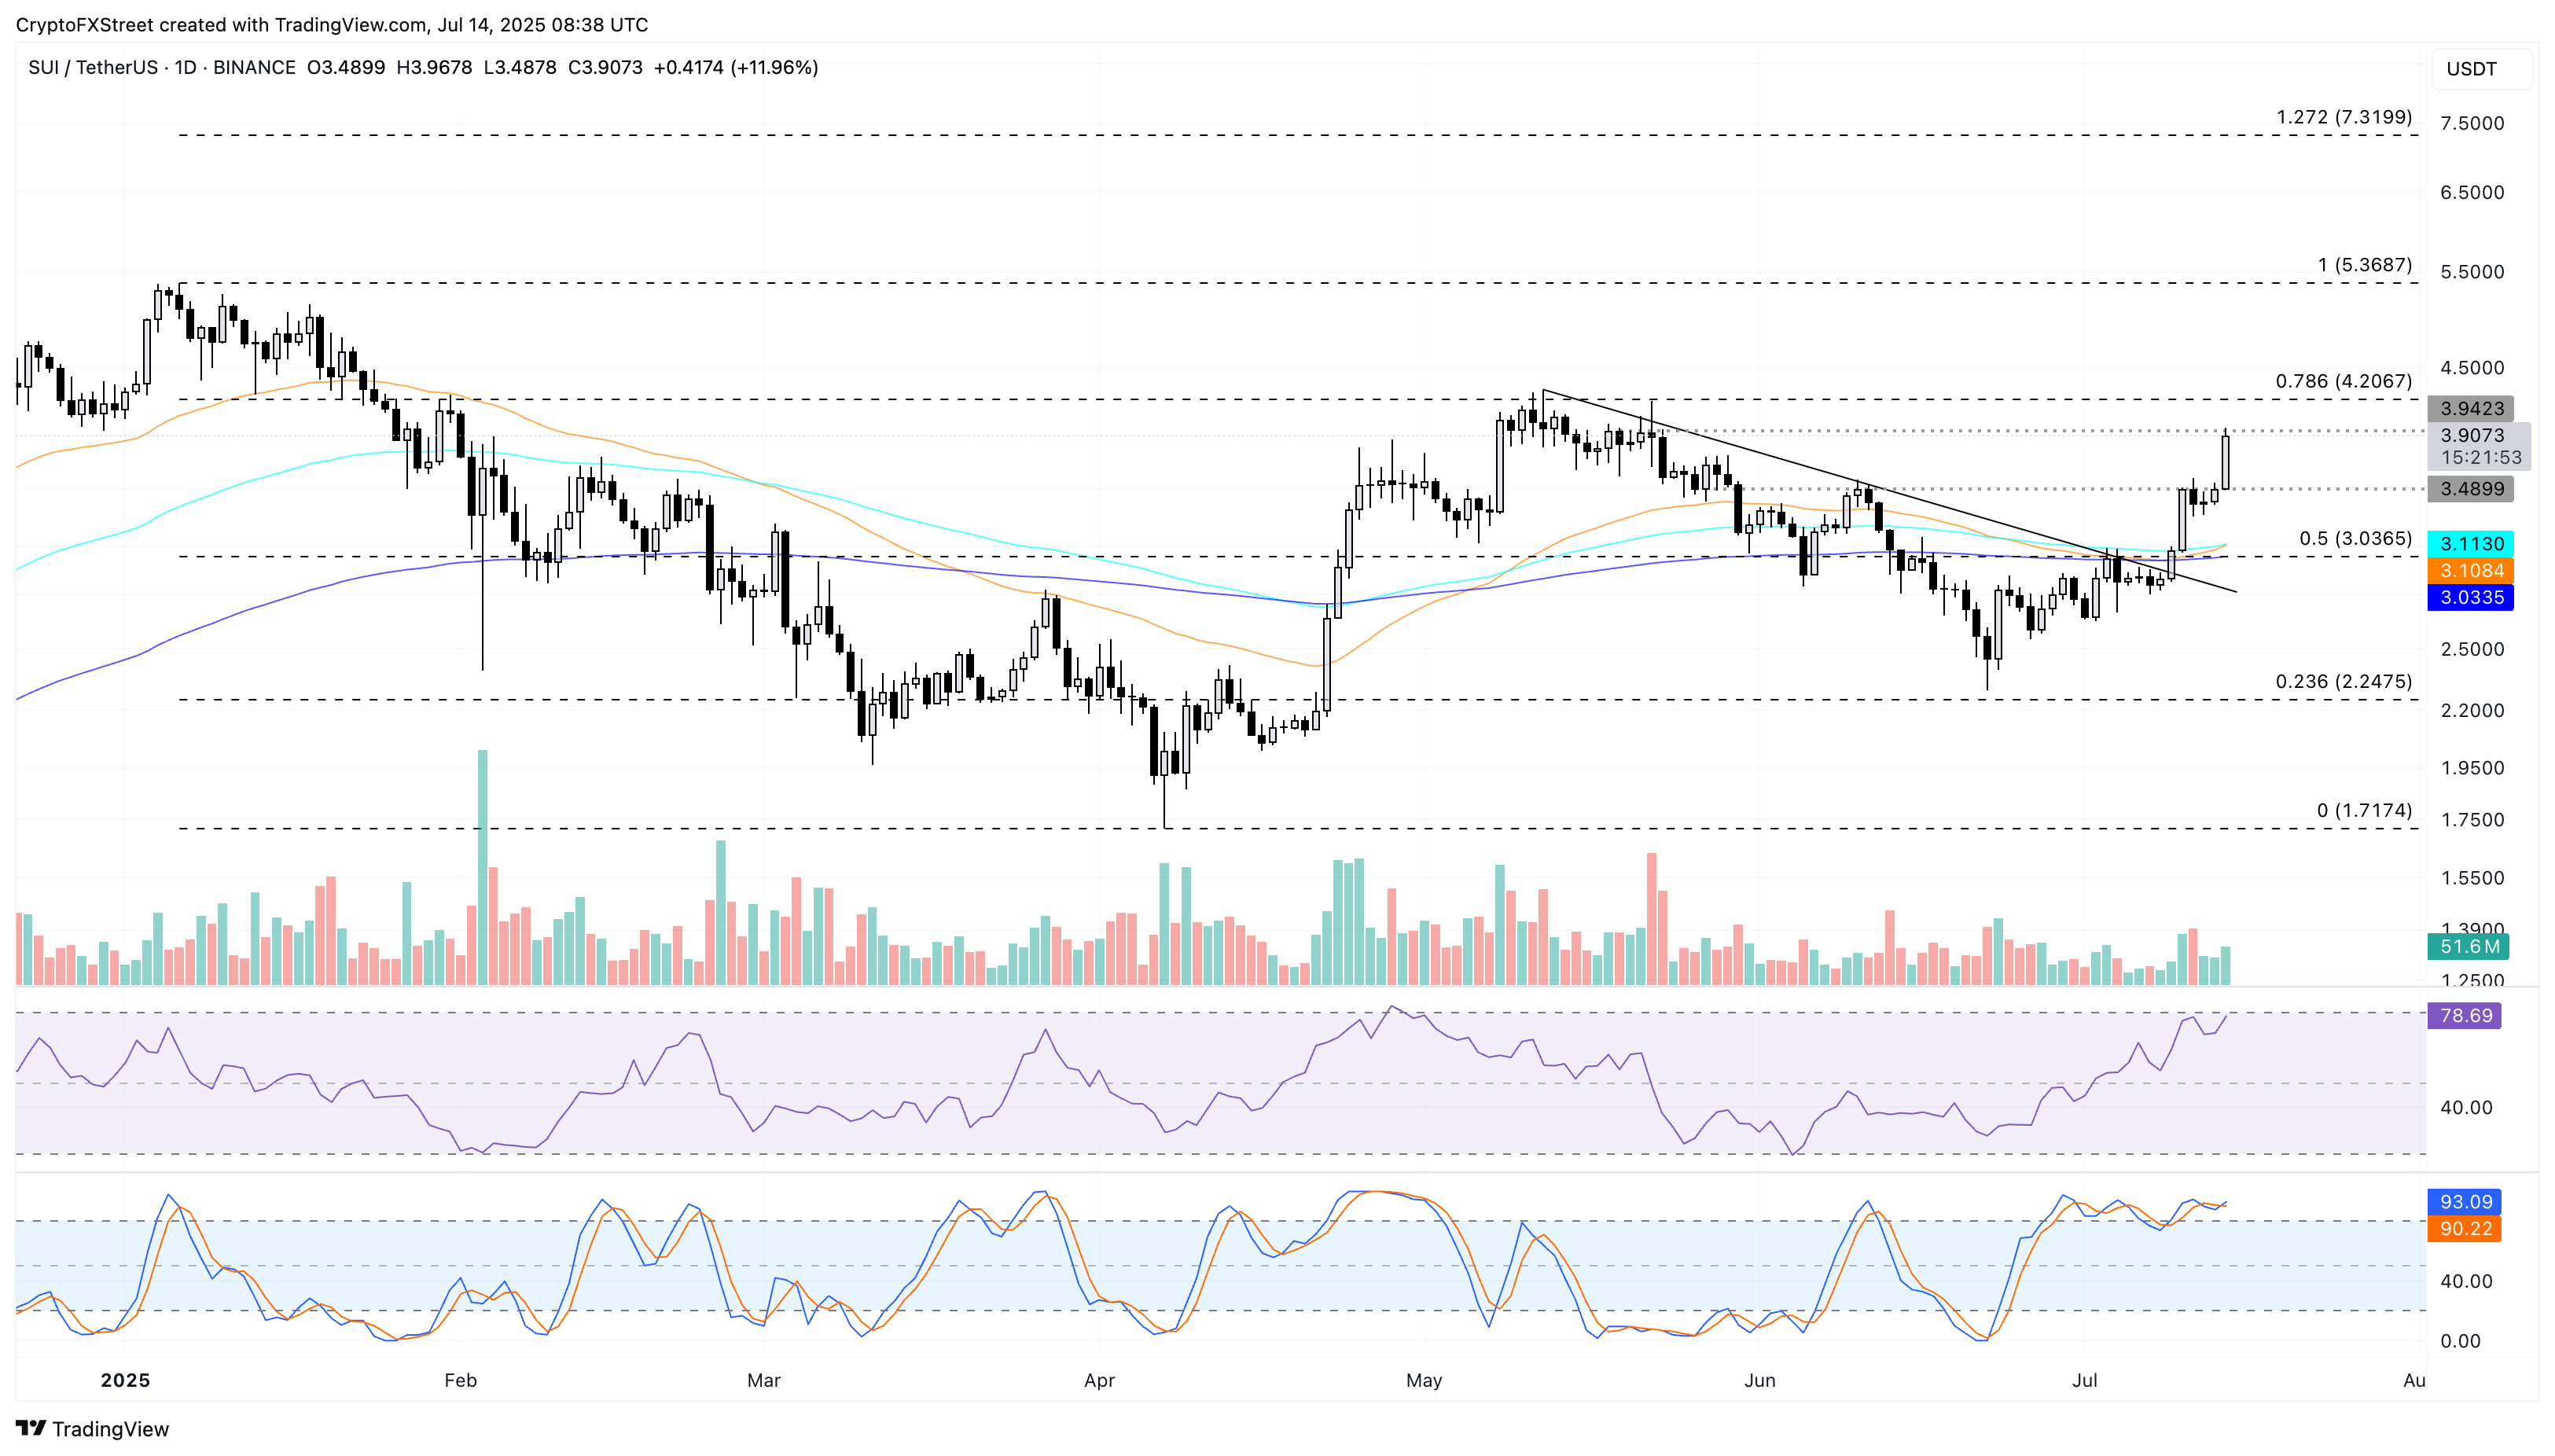
SUI/USDT daily price chart.
On the contrary, a reversal from the $4 mark could retest the $3.48 level, which acted as a resistance over the weekend.
추천 기사


