


Sui, Sei Price Prediction: Layer-1 tokens could extend decline as Bitcoin slips below $109,000
- Sui’s uptrend falters as sellers trim gains below the $3.00 critical level.
- Sei extends pullback by nearly 22% from June’s peak of $0.33, as key technical indicators offer bearish signals.
- Interest in Bitcoin remains steady despite the price sliding below $109,000.
Cryptocurrencies are generally edging lower on Friday, following in Bitcoin’s (BTC) footsteps. After an impressive run to $110,530 on Thursday, the largest crypto by market capitalization retreated, trading at around $108,964 at the time of writing.
Meanwhile, Layer-1 tokens Sui (SUI) and Sei (SEI) are back in the red, hovering at $2.93 and $0.26, respectively. Despite strong fundamentals, such as Sui’s steady Decentralized Finance (DeFi) Total Value Locked (TVL), which currently stands at $1.84 billion, key technical indicators are signaling bearishness that could keep prices subdued heading into the weekend.
Market overview: Bitcoin upholds risk-on sentiment
Bitcoin’s rally to $110,530 can be attributed to institutional interest and a strong derivatives market. According to QCP Capital, “listed corporates continue to anchor their spot allocations,” as reflected in recent filings from Strategy, Metaplanet, and Anthony Pompliano’s ProCap BTC LLC.
Bitcoin spot Exchange Traded Funds (ETFs) posted a total daily net inflow of around $602 million on Thursday, higher than Wednesday’s $408 million. The 12 ETFs operating in the United States (US) boast a cumulative total net inflow of approximately $49.6 billion, with net assets totaling $138 billion.
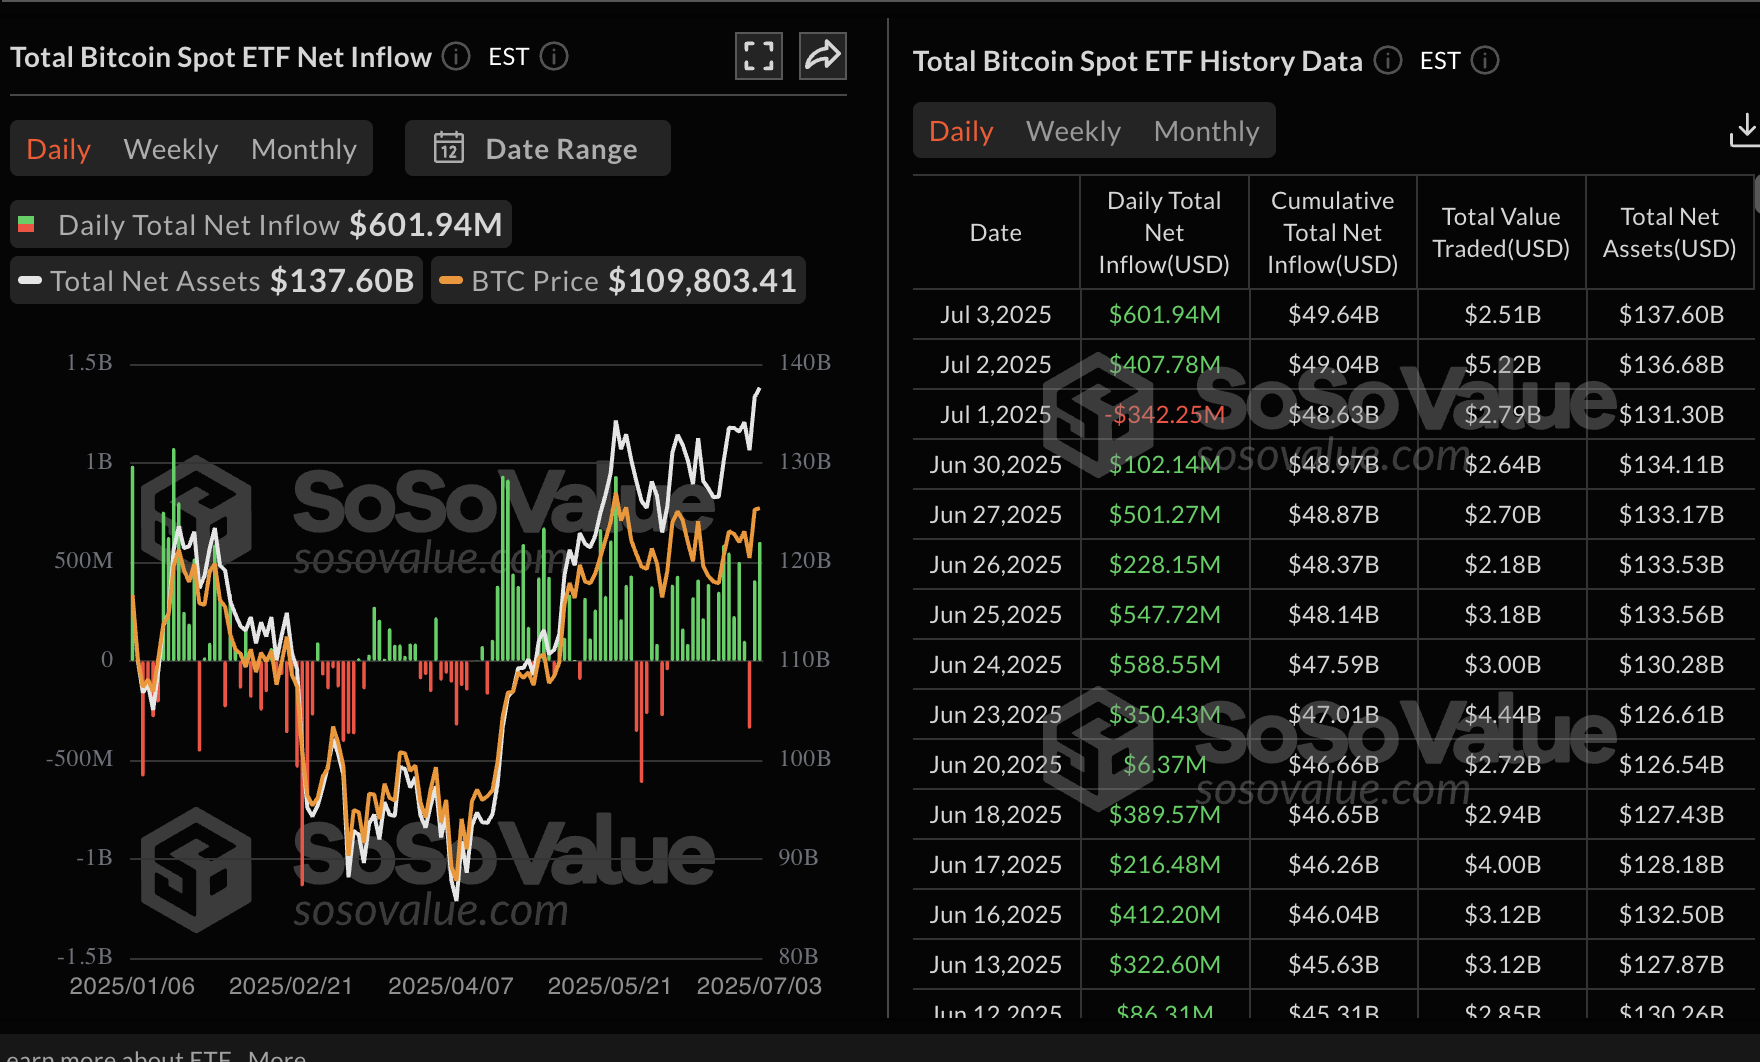
Bitcoin spot ETF data | Source: SoSoValue
The pullback below $109,000 suggests potential profit-taking amid growing macroeconomic uncertainty as US President Donald Trump’s 90-day tariffs pause deadline approaches on July 9.
Technically, Bitcoin’s structure is still bullish, supported above the recently broken descending trendline. A buy signal from the Moving Average Convergence Divergence (MACD) indicator maintained from June 26 could boost risk-on sentiment.
If traders increase exposure, a recovery could ensue, with Bitcoin pushing closer to the all-time high. Still, an extended decline below the trendline cannot be ruled out just yet. Hence, traders may want to prepare for tentative support around $106,500, which was tested on June 26, and the 50-day Exponential Moving Average (EMA) at $104,730.
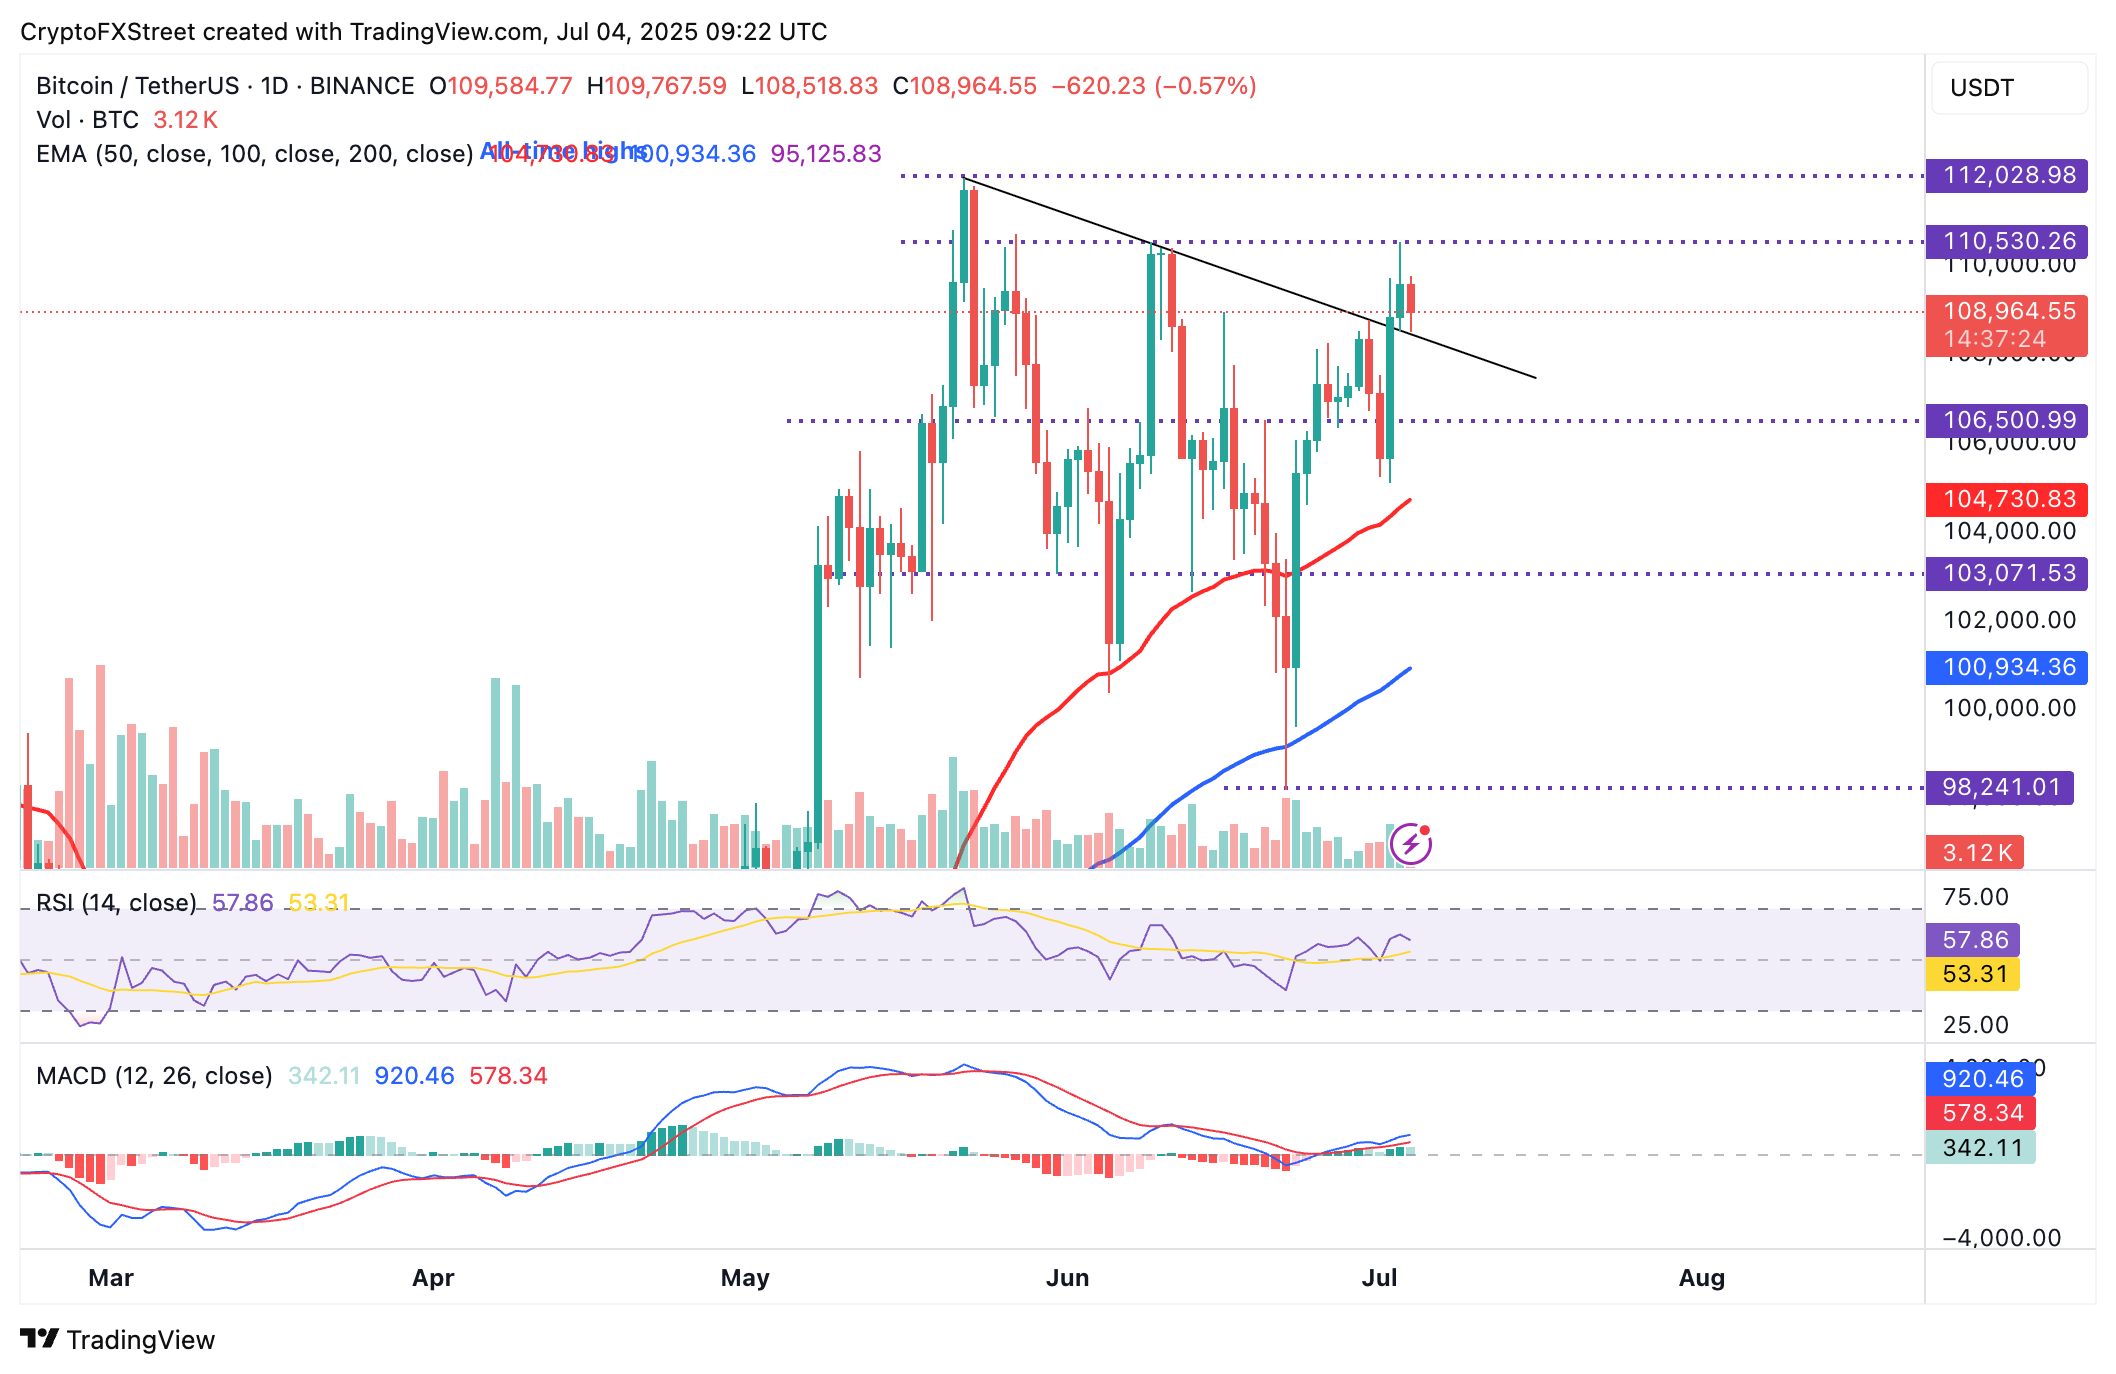
BTC/USDT daily chart
Altcoins update: Sui, Sei risk extending the decline
Sui’s price hovers at around $2.93 at the time of writing, down 3% on the day. The Layer-1 token, designed to provide a secure, robust, and scalable development environment, is currently trading below key moving averages, including the 100-day EMA at $3.08, the 50-day EMA at $3.03, and the 200-day EMA at $3.01.
The small pullback from Thursday’s highs of $3.08 could develop into a full-fledged downtrend if the Relative Strength Index (RSI) drops below the midline and extends toward oversold territory.
A retest of the descending channel’s upper boundary could provide the much-needed liquidity to steady recovery. However, it is too early to rule out a potential drop to previously tested support areas at $2.55 on June 22, $2.29 on June 22, and $1.70 on April 1.
Still, risk appetite for SUI could persist with the MACD indicator sustaining a buy signal, as indicated by the blue line crossing above the red line on Saturday.
If Sui breaks the resistance posed by the moving averages on the daily chart, the path of least resistance could shift upward, with targets at $3.30 and $4.00.
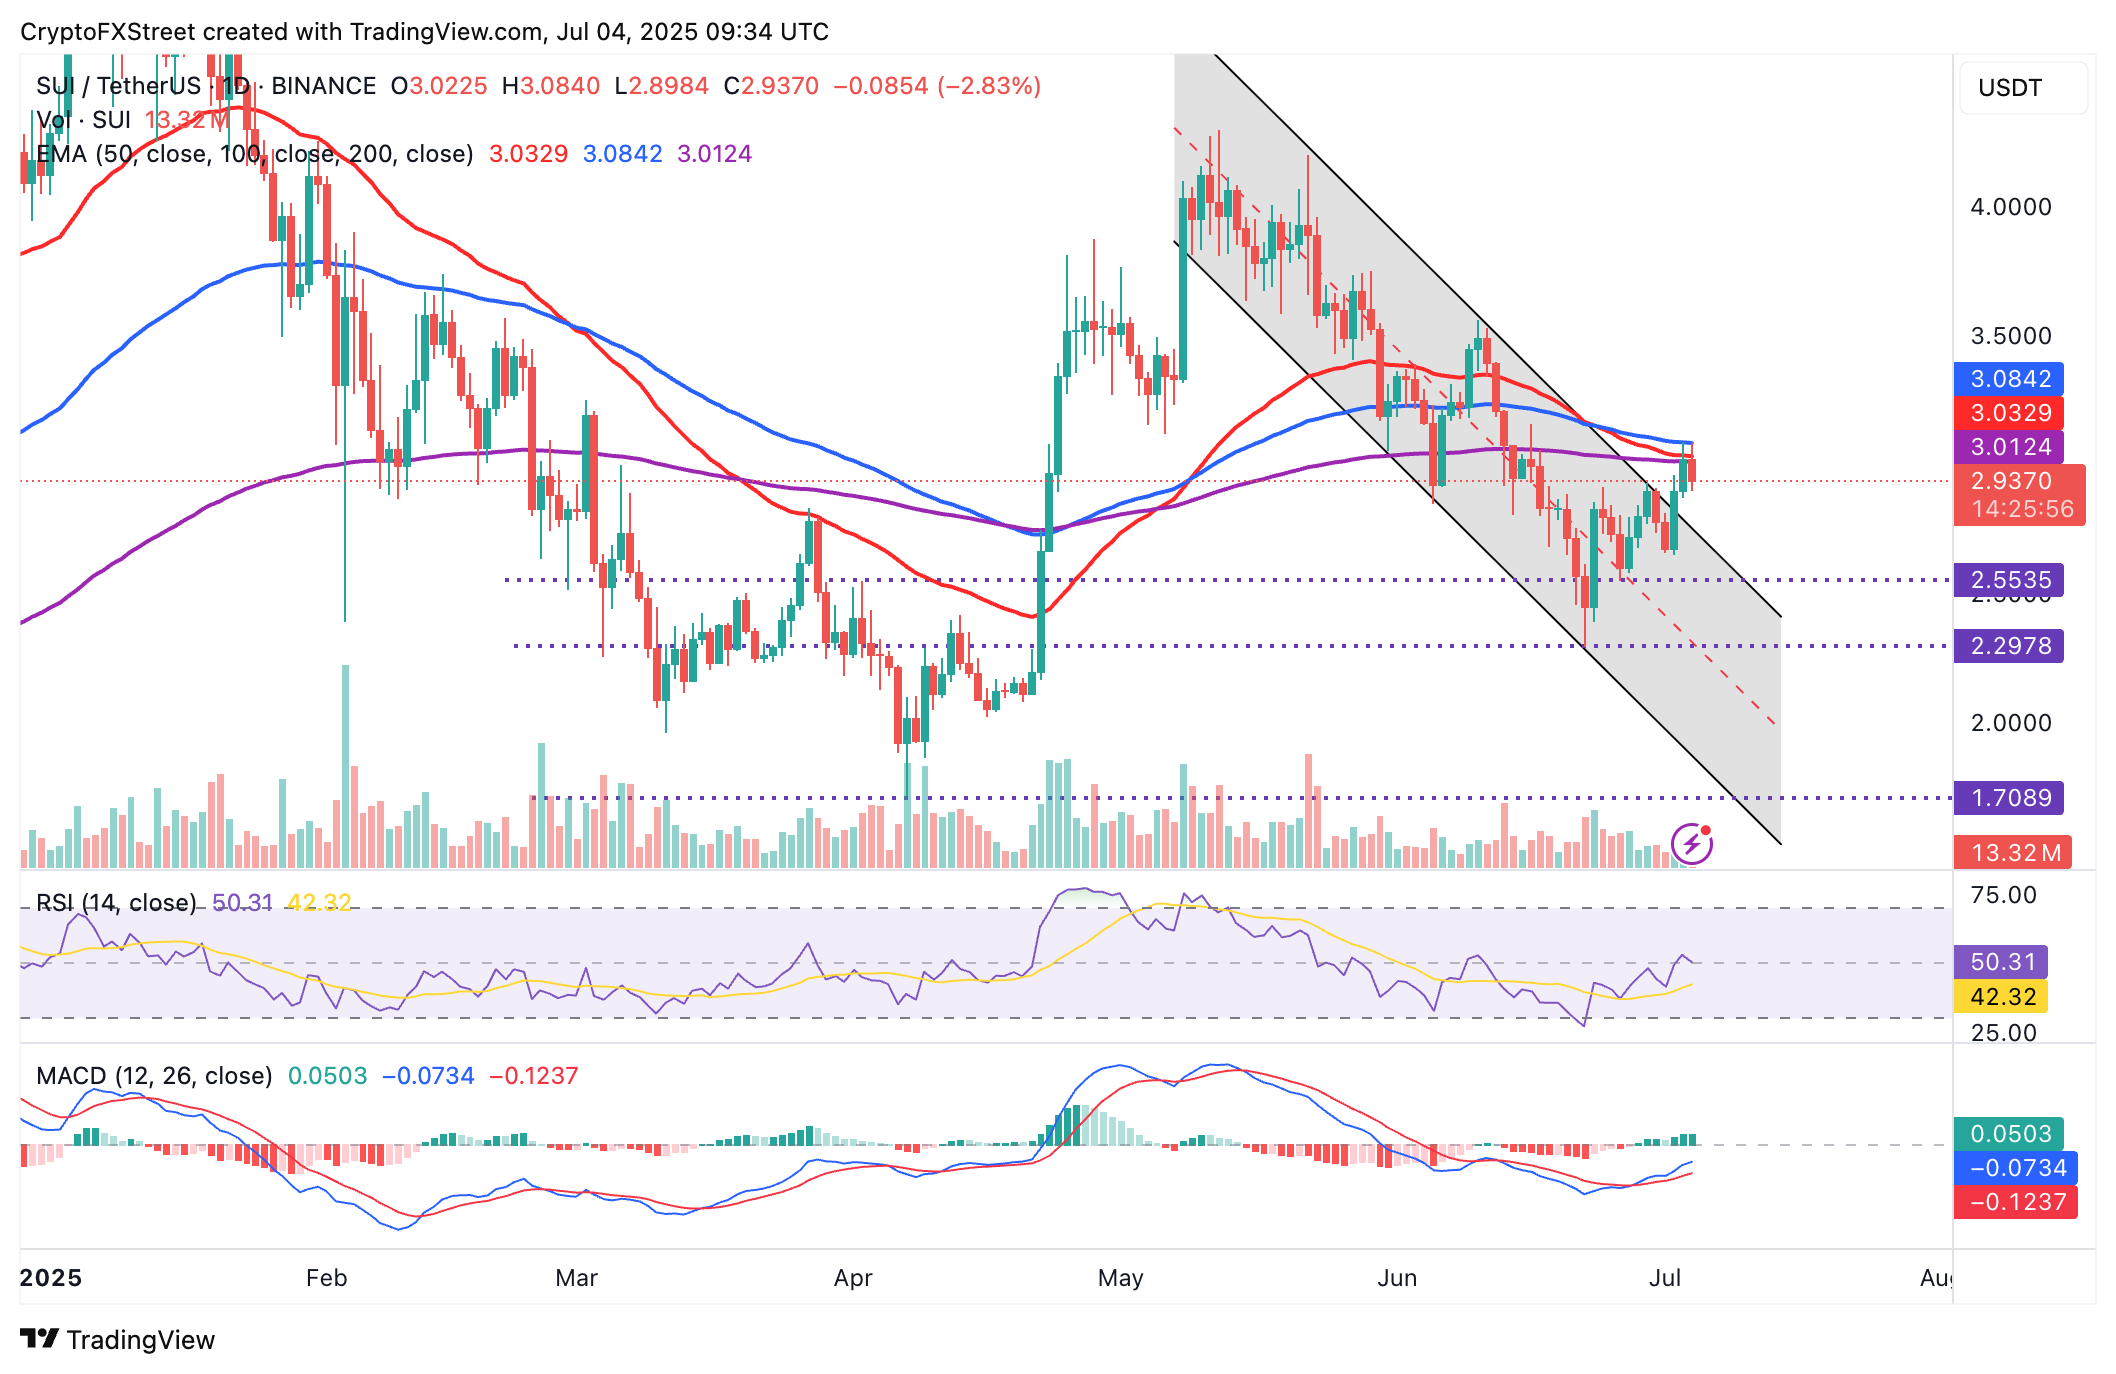
SUI/USD daily chart
As for Sei, sellers currently have the upper hand, extending the decline by over 3% on the day and almost 22% from highs in June at $0.33. The path of least resistance appears downward, with the MACD indicator on the cusp of validating a sell signal.
Traders will look for the blue MACD line to cross below the red signal line, indicating bearish momentum. If they reduce exposure, overhead pressure could intensify, increasing the risk of Sei falling to seek support at a confluence established by the 50-day EMA and the 100-day EMA at $0.23.
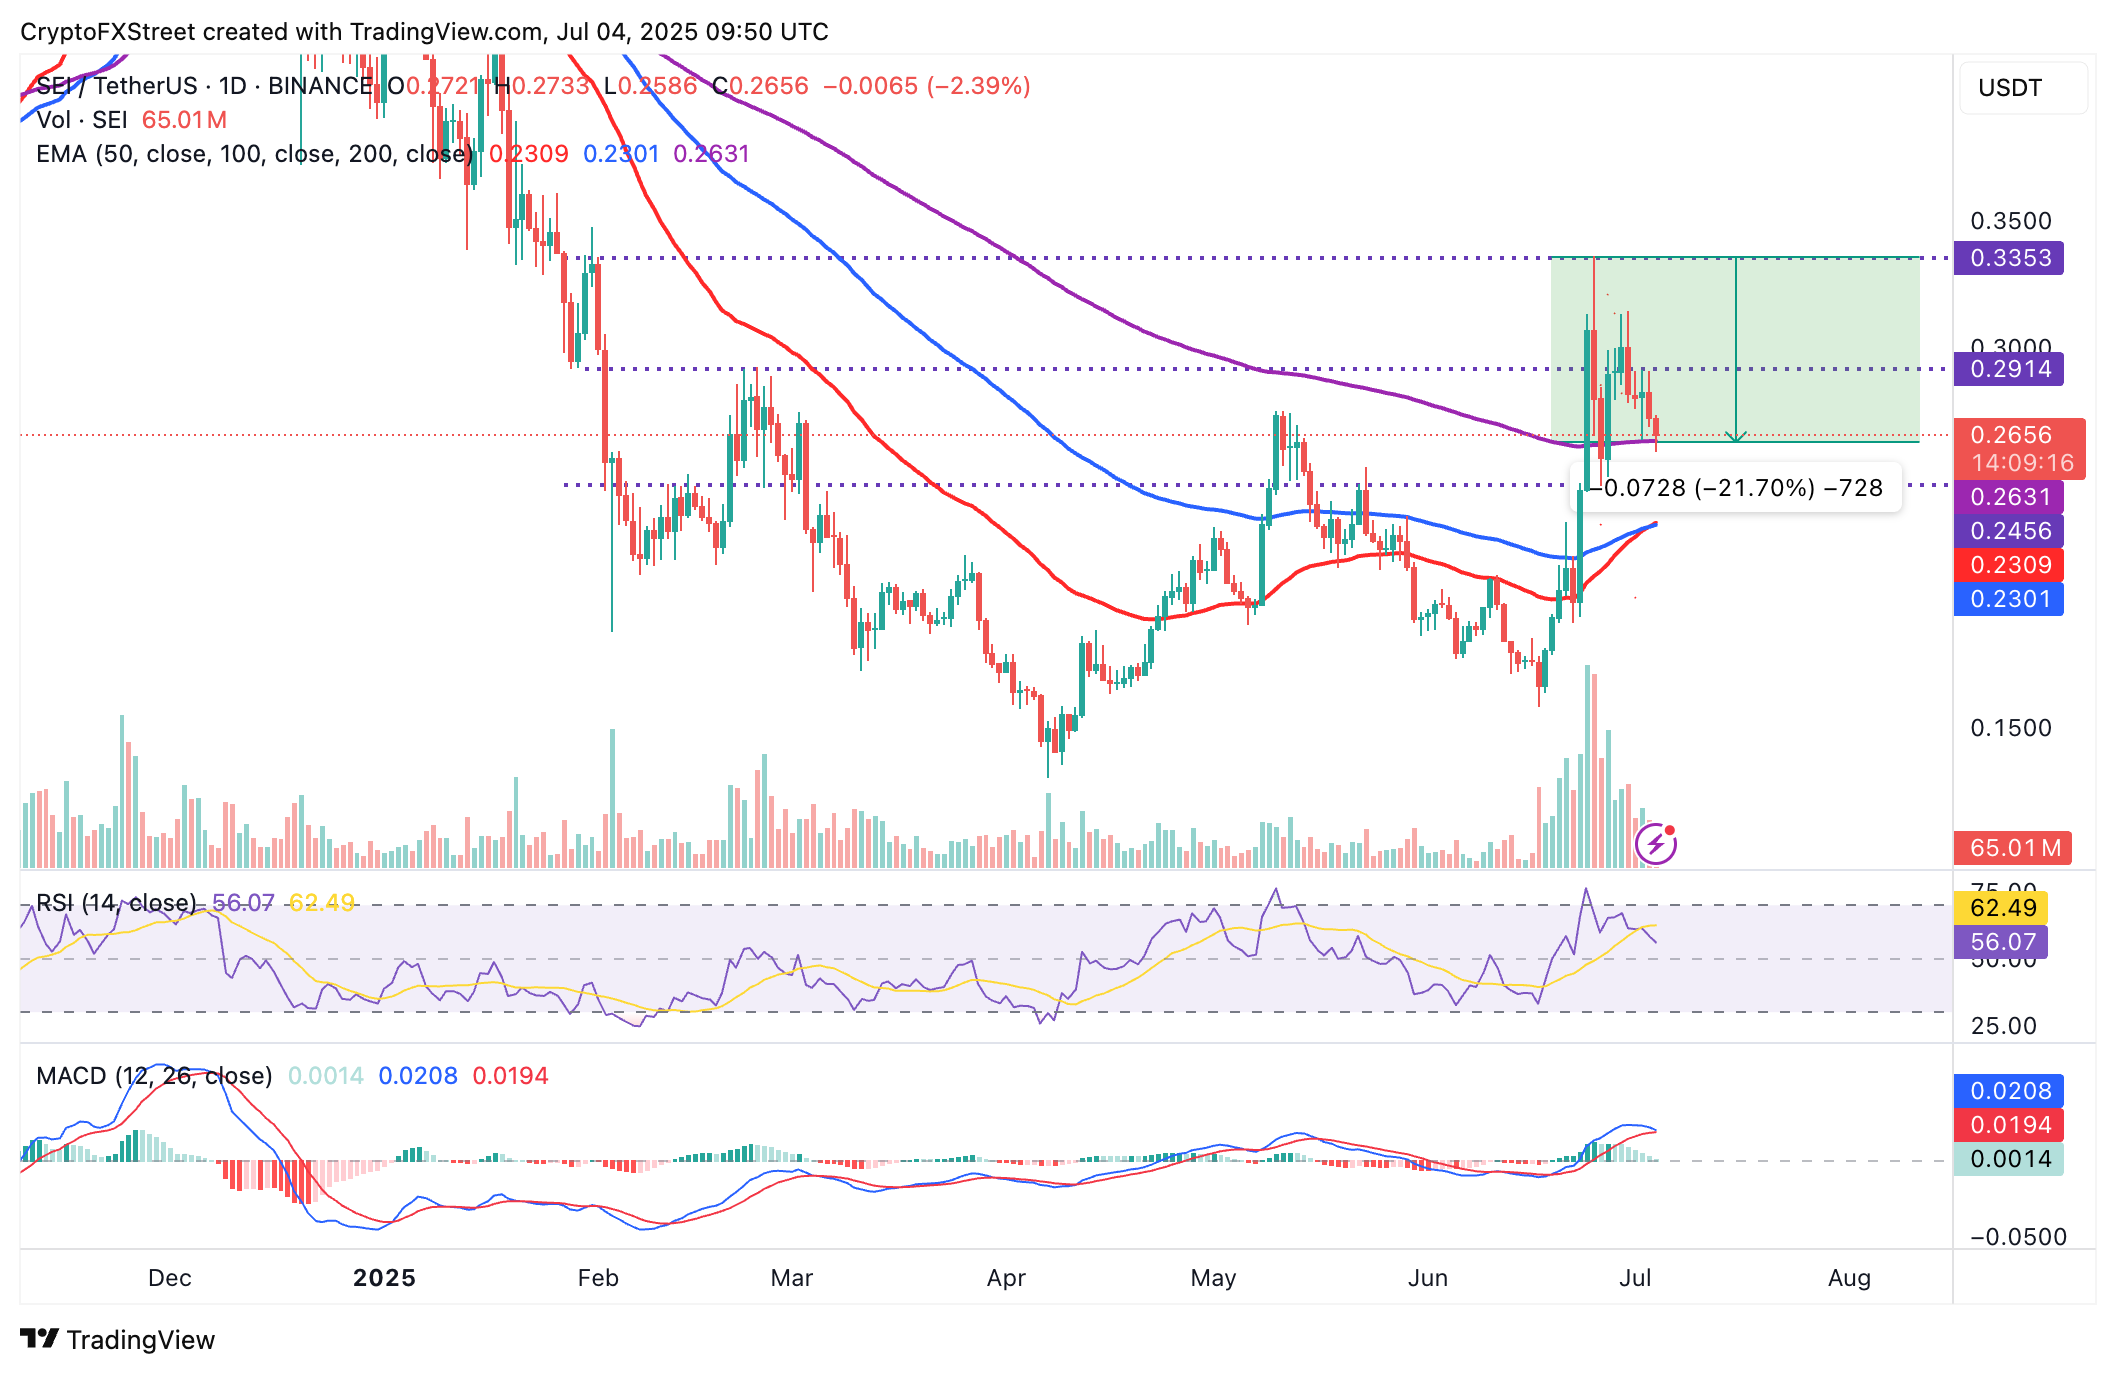
SEI/USDT daily chart
On the other hand, the 200-day EMA provides immediate support at $0.26, which could help stabilize the price in upcoming sessions. Key areas of interest in the event of recovery include $0.29, which tested as resistance on Thursday and capped the price in late February, as well as June’s peak of $0.33.
Cryptocurrency prices FAQs
Token launches influence demand and adoption among market participants. Listings on crypto exchanges deepen the liquidity for an asset and add new participants to an asset’s network. This is typically bullish for a digital asset.
A hack is an event in which an attacker captures a large volume of the asset from a DeFi bridge or hot wallet of an exchange or any other crypto platform via exploits, bugs or other methods. The exploiter then transfers these tokens out of the exchange platforms to ultimately sell or swap the assets for other cryptocurrencies or stablecoins. Such events often involve an en masse panic triggering a sell-off in the affected assets.
Macroeconomic events like the US Federal Reserve’s decision on interest rates influence crypto assets mainly through the direct impact they have on the US Dollar. An increase in interest rate typically negatively influences Bitcoin and altcoin prices, and vice versa. If the US Dollar index declines, risk assets and associated leverage for trading gets cheaper, in turn driving crypto prices higher.
Halvings are typically considered bullish events as they slash the block reward in half for miners, constricting the supply of the asset. At consistent demand if the supply reduces, the asset’s price climbs.
추천 기사


