


Aptos Price Forecast: APT extends bullish momentum, eyes further gains as Open Interest shoots up
- Aptos maintains bullish momentum, extending weekly gains by nearly 30%.
- A surge in APT Open Interest signals a spark of optimism in the derivatives market.
- The technical outlook shows that bulls target the resistance trendline of a four-month descending channel.
Aptos (APT) edges higher by 5%, recovering above the $5.00 mark at press time on Friday as it maintains heightened bullish momentum this week. Amid rising impulse, the APT Open Interest shoots up, representing a surge in optimism among derivative traders.
Still, Aptos maintains a larger descending channel pattern formed over the last four months. The technical outlook suggests further gains to challenge the upper boundary of the falling channel.
Optimism surge fuels Aptos’ Open Interest
CoinGlass’ data shows that Aptos Open Interest (OI) has increased by 20% to $232 million over the last 24 hours. A spike in OI is related to capital inflows in the derivatives market due to increased buying activity.

Aptos' Open Interest. Source: Coinglass
The Taker buy/sell volume indicator takes a bullish tilt as long positions volume accounts for 53.89% in the last four hours, pumping the long/short ratio to 1.16.
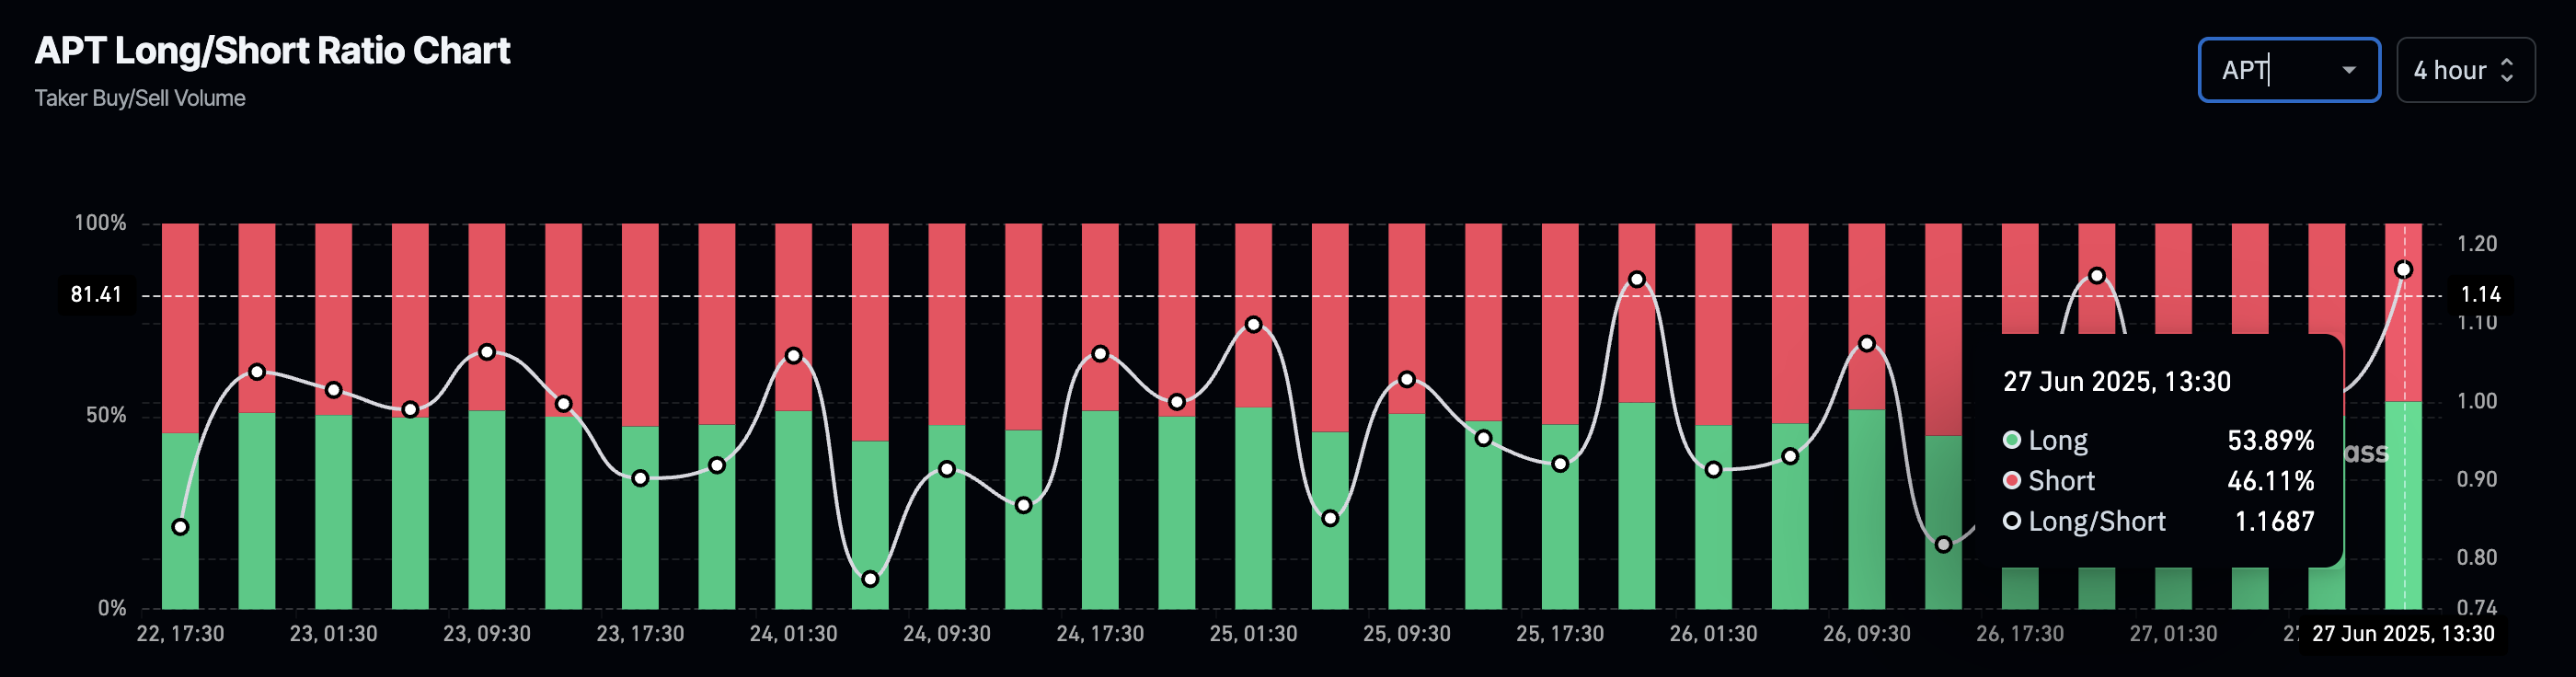
Aptos' long/short ratio. Source: Coinglass
Aptos eyes further gains to outgrow the descending channel
Aptos extends its weekly gains with the intraday rise of 5% at press time on Friday. The price action showcases weekly recovery forming a V-shaped reversal to challenge the monthly high of $5.26 set on June 11.
Still, Aptos remains trapped in a falling channel formed by a resistance trendline connected from the monthly highs of March and May. Meanwhile, the support trendline is formed by connecting the lows on February 3, April 6, and June 23.
A daily close above the monthly high could target the overhead trendline resistance at $5.91.
The Moving Average Convergence/Divergence (MACD) indicator shows a bullish crossover, with the MACD crossing above the signal line on Tuesday. The fresh wave of green histogram bars suggests a boost in bullish momentum.
The Relative Strength Index (RSI) at 59 crosses above the midpoint line, suggesting increasing bullish momentum while indicating room for growth before reaching overbought conditions.
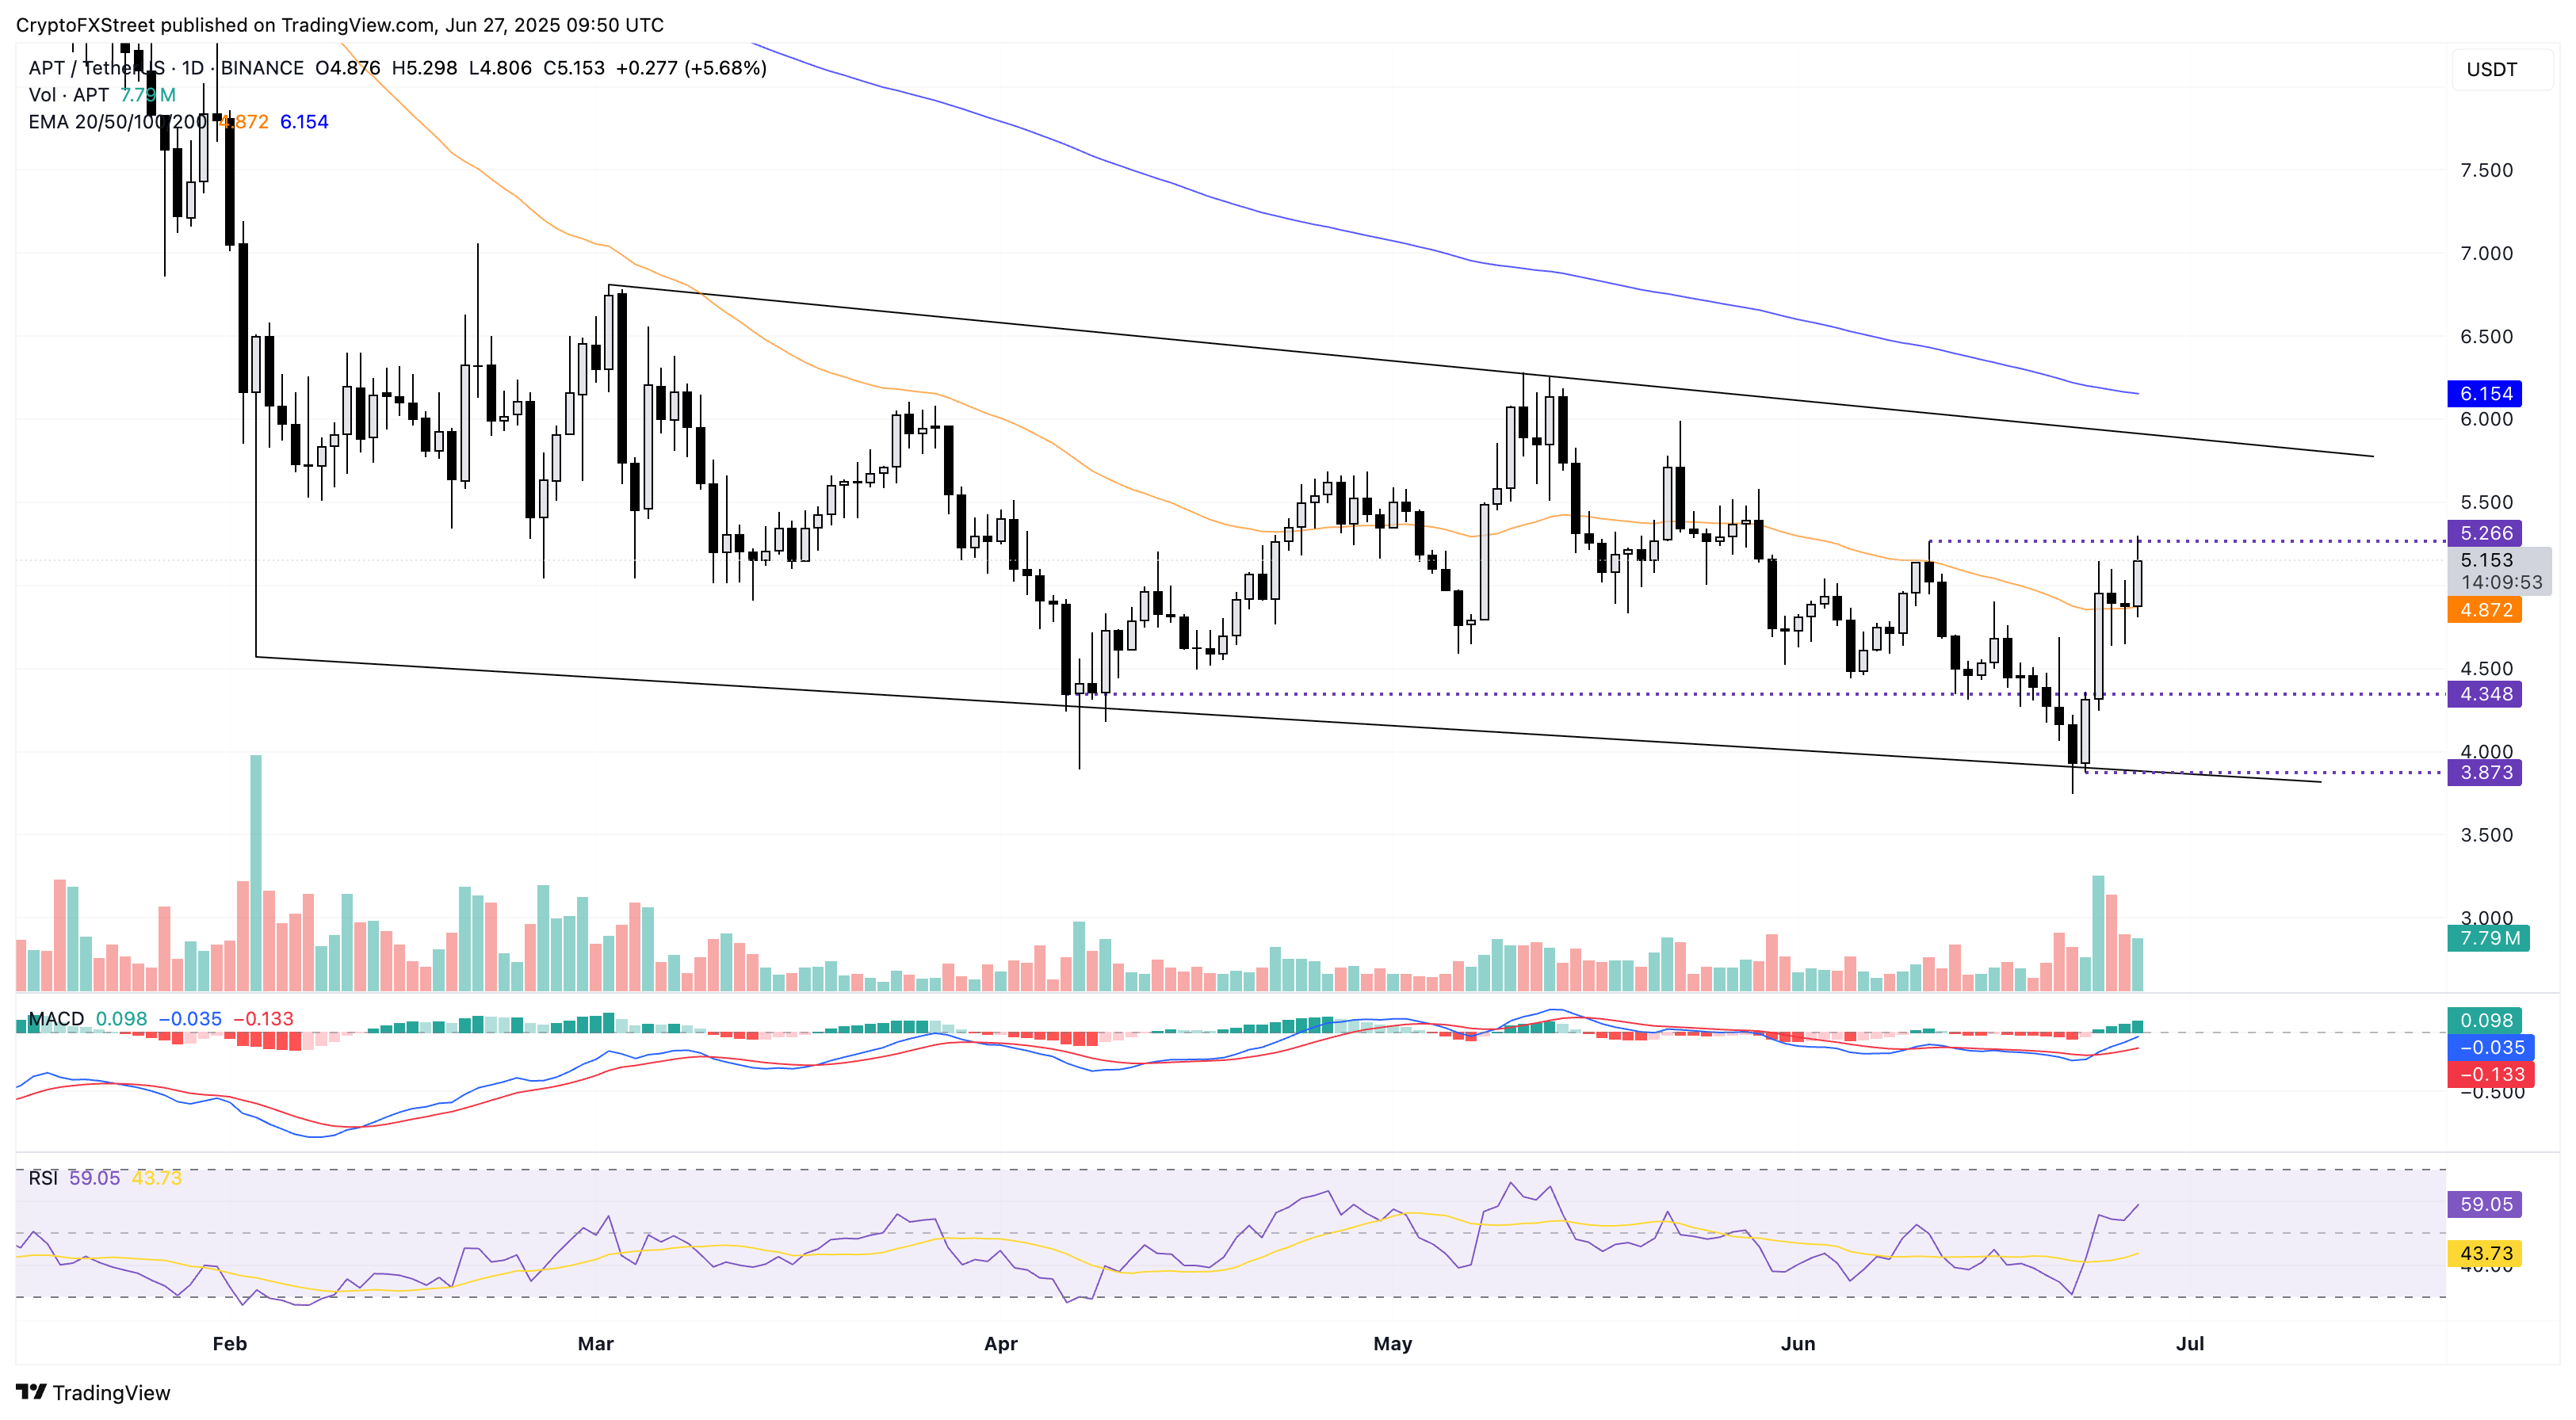
APT/USDT daily price chart.
However, a closing below the 50-day Exponential Moving Average (EMA) at $4.87 could test the $4.34 support last tested on June 18.
추천 기사


