

Bitcoin Price Forecast: BTC range-bound as momentum indicator shows trader indecisiveness
- Bitcoin price hovers around $87,000 on Thursday, as RSI indicator suggests indecisiveness among traders.
- Glassnode reports that BTC trades in a range-bound market, as on-chain profit-and-loss-taking events are declining in magnitude.
- US Senator Elizabeth Warren raises concerns that stablecoin bill could allow Trump and Elon Musk to gain control over people's money.
Bitcoin (BTC) price hovers around $87,000 at the time of writing on Thursday, while its Relative Strength Index (RSI) indicators suggest indecisiveness among traders. Moreover, Glassnode reports that BTC trades in a range-bound market, as on-chain profit-and-loss-taking events are declining in magnitude, highlighting a weaker demand profile and less sell-side pressure.
Meanwhile, in the United States, Senator Elizabeth Warren has voiced her concerns that the approved stablecoin bill could allow Trump and Elon Musk to gain control over people's money, urging Congress to make changes.
Bitcoin trades in a range-bound market
The Glassnode' Forging Long-Term Holders' report on Wednesday highlights that the Bitcoin market is trading within a new range between $78,000 and $88,000. On-chain profit and loss-taking events are declining in magnitude, highlighting a weaker demand profile and less sell-side pressure.
The report further explains that the Short-Term Holders are experiencing fairly significant financial stress, with a large proportion of their holdings now underwater relative to the original cost basis, as shown in the graph below.
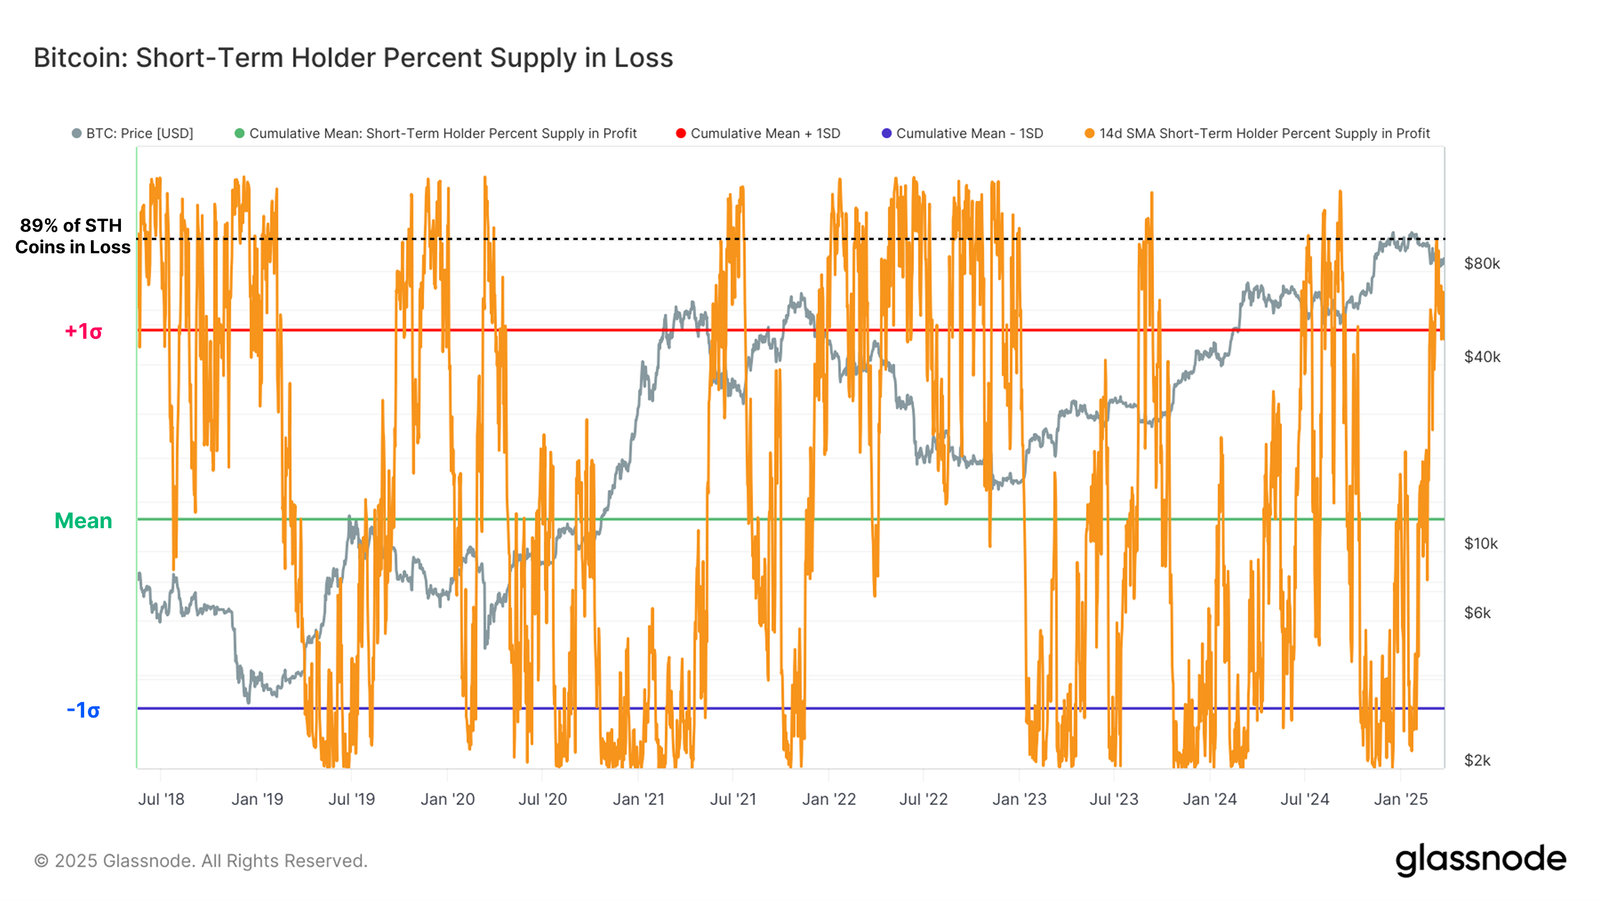
Bitcoin STH percentage supply in loss chart. Source: Glassnode
"Whilst the STH cohort are dominating losses taken, the Long-Term Holder cohort are transitioning back into a period of accumulation, and we expect their aggregate supply to grow in the coming weeks and months as a result," says Glassnode analyst.
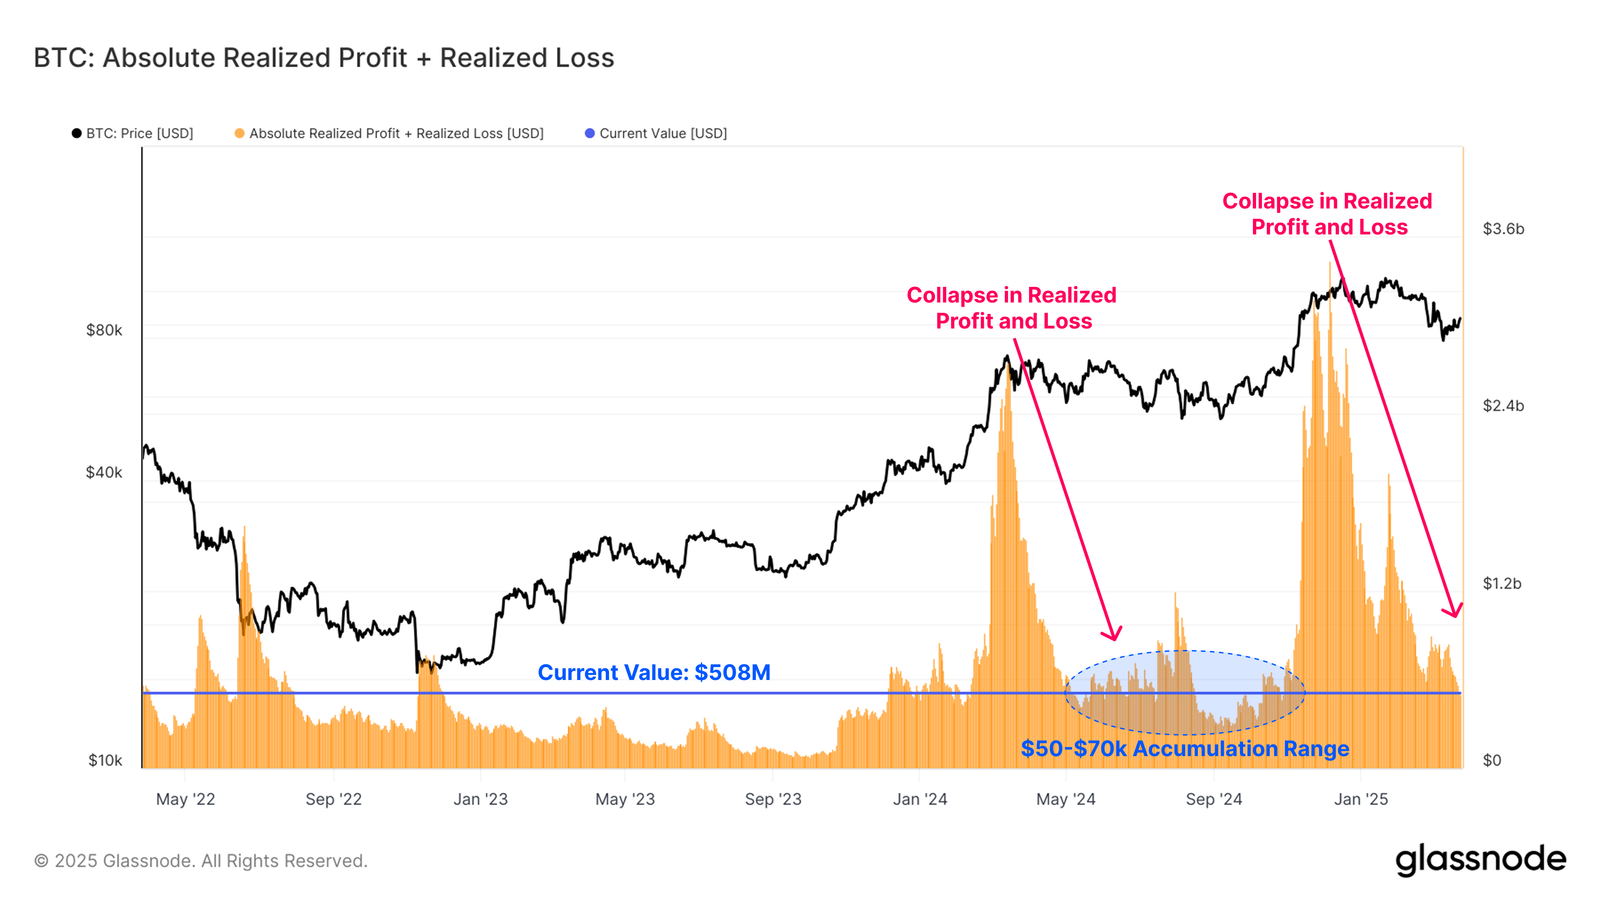
BTC: Absolute realized profit + realized loss chart. Source: Glassnode
QCP Capital's report highlights that the uncertainty surrounding the US trade policy and the broader political landscape remain at the forefront of mind. Trump announced on Wednesday further tariff measures on the automobile industry ahead of the April 2 deadline. However, the market still lacks clarity on the scope, timing, and magnitude of these potential actions. Until then, QCP analysts expect more sideways volatility.
US Senator Elizabeth Warren warns against stablecoin bill
US Senator Elizabeth Warren raised concerns on her social media account X on Wednesday about the current stablecoin bill.
The Massachusetts senator urged the US Congress to step up and address the issues before it makes it easier for figures like Trump and Elon Musk to gain control over people's money.
Warren posted, "This is Donald Trump's latest grift to enrich himself. Congress should step up and fix the current stablecoin bill moving through the Senate that will make it easier for Trump – and Elon Musk – to take control of your money."
The Guiding and Establishing National Innovation for US Stablecoins (GENIUS Act), passed by the Senate Banking Committee on March 14, sets forth licensing and regulatory requirements for stablecoin issuers, distinguishing between federal oversight for larger issuers and state regulation for smaller ones.
The approval of the stablecoin bill is expected to positively impact Bitcoin prices in the long term by fostering broader crypto adoption without undermining Bitcoin’s role.
Bitcoin Price Forecast: RSI flattens, suggesting indecisiveness among traders
Bitcoin price broke and closed above its 200-day Exponential Moving Average (EMA) at around $85,570 on Sunday and rose 4.45% until Monday. However, BTC stabilized around $87,000 the next day and declined slightly, retesting the 200-day EMA on Wednesday. At the time of writing on Thursday, it continues to trade slightly above that level, approaching a descending trendline (drawn by connecting multiple high levels since mid-January).
If the 200-day holds as support and BTC breaks and closes above the descending trendline, it could extend the recovery to retest the key psychological level of $90,000. A successful close above this level could extend an additional rally toward its March 2 high of $95,000.
The RSI on the daily chart reads 51, floating around its neutral level of 50, indicating indecisiveness among the traders. For the bullish momentum to be sustained, the RSI must point upward and move above its neutral level of 50.
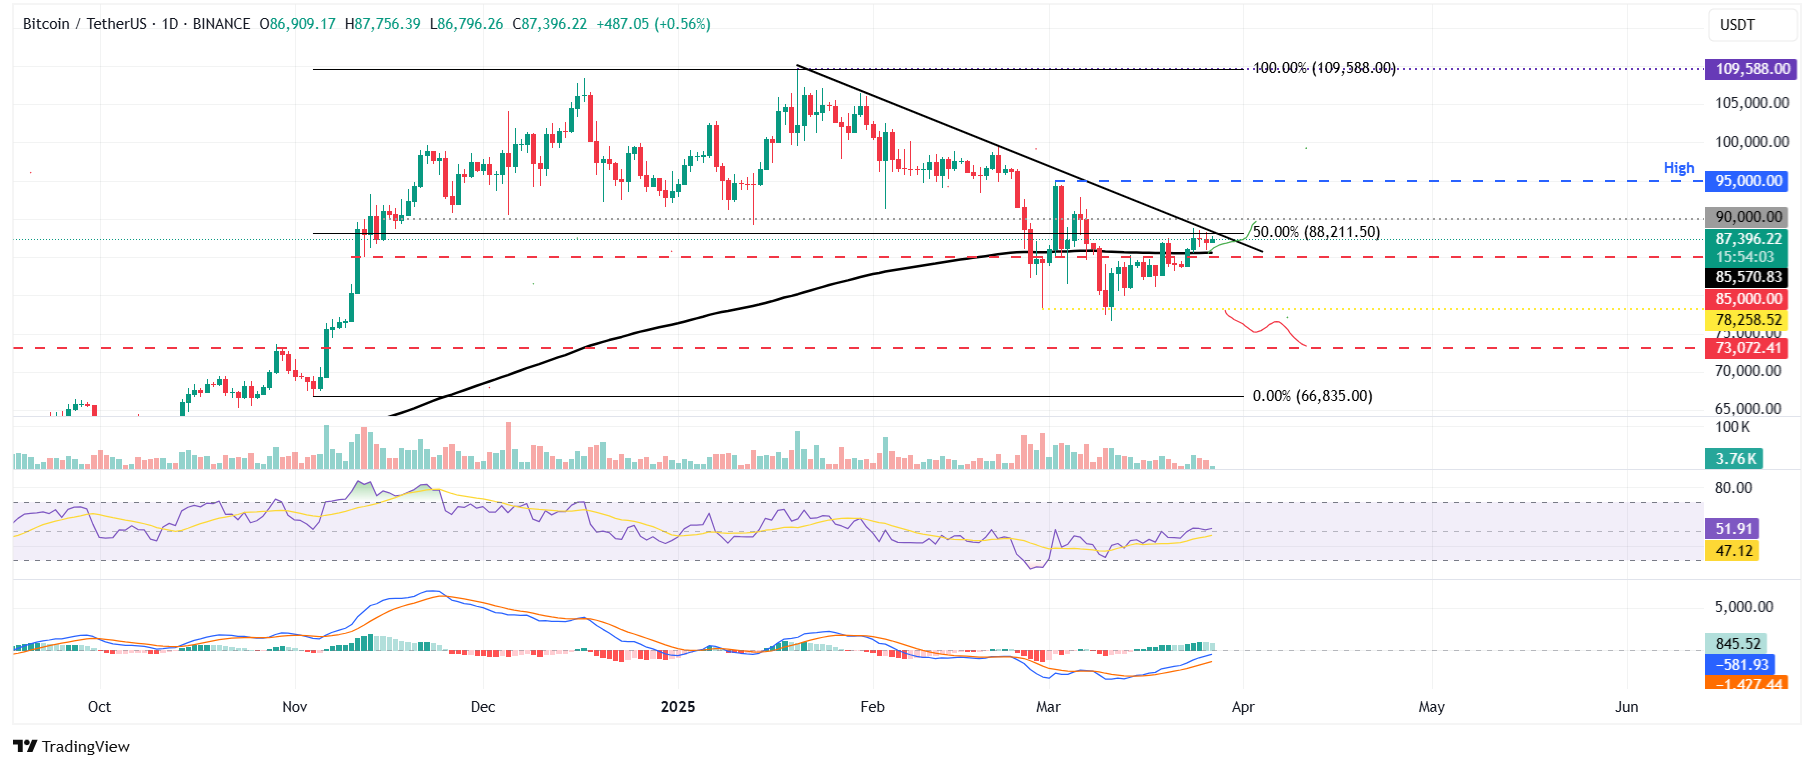
BTC/USDT daily chart
However, if BTC faces a rejection from the descending trendline and closes below the 200-day EMA, it could extend the decline to retest its next support level at $78,258.
Bitcoin, altcoins, stablecoins FAQs
Bitcoin is the largest cryptocurrency by market capitalization, a virtual currency designed to serve as money. This form of payment cannot be controlled by any one person, group, or entity, which eliminates the need for third-party participation during financial transactions.
Altcoins are any cryptocurrency apart from Bitcoin, but some also regard Ethereum as a non-altcoin because it is from these two cryptocurrencies that forking happens. If this is true, then Litecoin is the first altcoin, forked from the Bitcoin protocol and, therefore, an “improved” version of it.
Stablecoins are cryptocurrencies designed to have a stable price, with their value backed by a reserve of the asset it represents. To achieve this, the value of any one stablecoin is pegged to a commodity or financial instrument, such as the US Dollar (USD), with its supply regulated by an algorithm or demand. The main goal of stablecoins is to provide an on/off-ramp for investors willing to trade and invest in cryptocurrencies. Stablecoins also allow investors to store value since cryptocurrencies, in general, are subject to volatility.
Bitcoin dominance is the ratio of Bitcoin's market capitalization to the total market capitalization of all cryptocurrencies combined. It provides a clear picture of Bitcoin’s interest among investors. A high BTC dominance typically happens before and during a bull run, in which investors resort to investing in relatively stable and high market capitalization cryptocurrency like Bitcoin. A drop in BTC dominance usually means that investors are moving their capital and/or profits to altcoins in a quest for higher returns, which usually triggers an explosion of altcoin rallies.
추천 기사


