


Ethereum Price Forecast: ETH struggles before $2,817, Pectra to launch on testnet on February 26 and March 5
Ethereum price today: $2,670
- Pectra could launch on the Ethereum mainnet in April as developers set February 26 and March 5 for Holesky and Sepolia testnet upgrades.
- Ethereum's share of the global crypto market capitalization reached a four-year low.
- ETH could test the upper boundary of a descending channel if it reclaims and sustains a move above $2,817.
Ethereum (ETH) is down 3% on Thursday as developers agreed that the Pectra upgrade will officially launch on the Holesky and Sepolia testnets in February and March. Meanwhile, ETH could test the upper boundary line of a key descending channel if it sustains a firm move above the $2,817 level.
Pectra upgrade to potentially launch in April
In its 150th All Core Developers Consensus (ACDC) call #150 on Thursday, Ethereum developers agreed on official dates for the Pectra upgrade to go live on testnets, with a potential mainnet upgrade set for April.
Pectra will hit the Holesky and Sepolia testnets on February 26 and March 5, respectively. According to Tim Beiko, protocol support lead at the Ethereum Foundation, developers will meet again on March 6 to choose the date for Pectra to go live on the mainnet for all users — potentially in early April, 30 days after the testnet launch "assuming everything goes smoothly."
Pectra is going live
— timbeiko.eth (@TimBeiko) February 6, 2025
Holesky will fork at slot 3710976 (Mon, Feb 24 at 21:55:12 UTC)
Sepolia will fork at slot 7118848 (Wed, Mar 5 at 07:29:36 UTC)
Assuming Sepolia goes smoothly, we'll pick the mainnet slot on the March 6 ACD call
Pectra features a series of upgrades to the Ethereum mainnet, including account abstraction features like transaction batching, sponsored transactions and wallet recovery. Other improvements include an increase in the maximum staking balance from 32 ETH to 2,048 ETH to help validators consolidate their nodes and advanced zero-knowledge improvements to boost privacy.
A successful Pectra upgrade could spark renewed interest in ETH and help the Ethereum Foundation overcome the heavy criticisms it has received from community members lately.
The criticisms largely stem from Ethereum's underperformance of Bitcoin and several top altcoins. The top altcoin's share of the total crypto market capitalization dropped to a four-year low, noted JP Morgan analysts led by Nikolaos Panigirtzoglou in a report on Wednesday.
The analysts highlighted Ethereum's lack of a strong narrative compared to Bitcoin's branding as a store of value and how it lags behind Solana and Layer 2 networks as reasons for its underperformance.
Meanwhile, Ethereum exchange-traded funds (ETFs) stretched their positive flows streak to five consecutive days after recording a net inflow of $18.10 million on Wednesday. This marks net inflows of over half a billion dollars in the past five days.
Ethereum Price Forecast: ETH could test a descending channel's upper boundary if ETH reclaims $2,817
Ethereum saw $46.50 million in futures liquidations in the past 24 hours, per Coinglass data. The total amount of long and short liquidations accounted for $31.66 million and $14.83 million, respectively.
Ethereum saw a rejection near the 2,817 level and is trading within a descending channel on the daily chart, with lower and upper boundary trendlines connecting lower lows and lower highs from December 17.
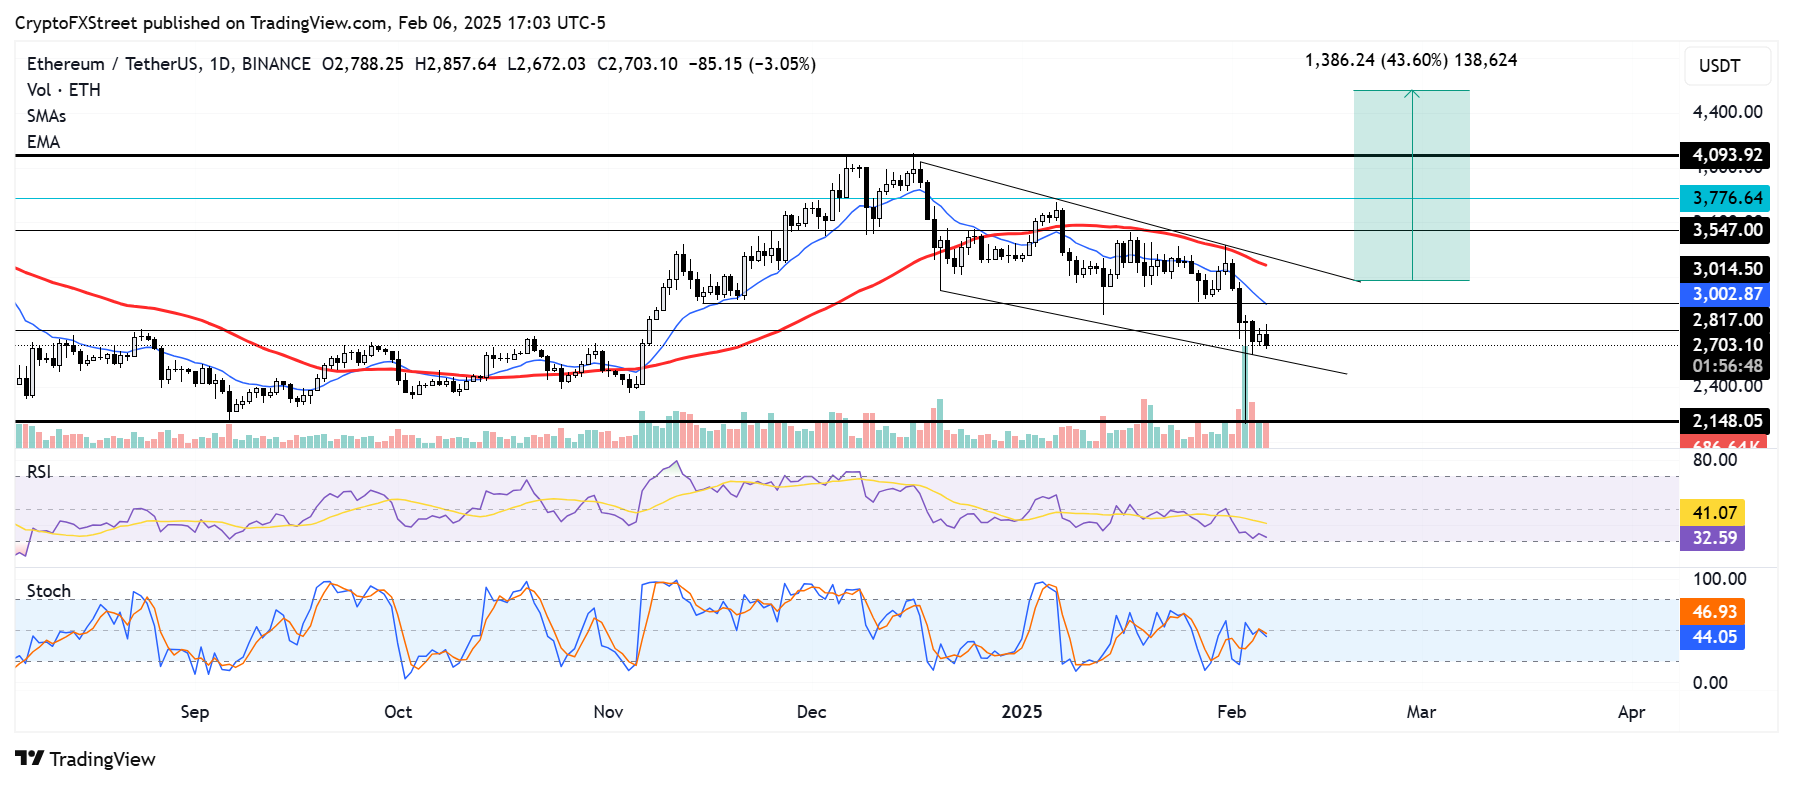
ETH/USDT daily chart
If ETH reclaims and sustains an extended move above the $2,817 support level, it could rally to test the channel's upper boundary line resistance.
A decisive move above the upper boundary line and the 50-day Simple Moving Average (SMA), establishing both as support levels, will confirm a bullish breakout. This could lead to an ETH rally of over 40% toward the $4,500 level.
For such a move to materialize, the top altcoin has to clear key resistance hurdles near the $3,550, $3,770, and $4,100 levels.
On the downside, ETH will validate a bearish breakdown if ETH declines below the descending channel's lower boundary support line. Such a move could send ETH toward $1,200 if the $2,100 critical support fails.
The Relative Strength Index (RSI) and Stochastic Oscillator (Stoch) are below their neutral levels, indicating a dominant bearish momentum. Both indicators need to move above their neutral levels for ETH to flip bullish.
Ethereum FAQs
Ethereum is a decentralized open-source blockchain with smart contracts functionality. Its native currency Ether (ETH), is the second-largest cryptocurrency and number one altcoin by market capitalization. The Ethereum network is tailored for building crypto solutions like decentralized finance (DeFi), GameFi, non-fungible tokens (NFTs), decentralized autonomous organizations (DAOs), etc.
Ethereum is a public decentralized blockchain technology, where developers can build and deploy applications that function without the need for a central authority. To make this easier, the network leverages the Solidity programming language and Ethereum virtual machine which helps developers create and launch applications with smart contract functionality.
Smart contracts are publicly verifiable codes that automates agreements between two or more parties. Basically, these codes self-execute encoded actions when predetermined conditions are met.
Staking is a process of earning yield on your idle crypto assets by locking them in a crypto protocol for a specified duration as a means of contributing to its security. Ethereum transitioned from a Proof-of-Work (PoW) to a Proof-of-Stake (PoS) consensus mechanism on September 15, 2022, in an event christened “The Merge.” The Merge was a key part of Ethereum's roadmap to achieve high-level scalability, decentralization and security while remaining sustainable. Unlike PoW, which requires the use of expensive hardware, PoS reduces the barrier of entry for validators by leveraging the use of crypto tokens as the core foundation of its consensus process.
Gas is the unit for measuring transaction fees that users pay for conducting transactions on Ethereum. During periods of network congestion, gas can be extremely high, causing validators to prioritize transactions based on their fees.
추천 기사


