

Top 3 Price Prediction: Bitcoin, Ethereum, Ripple – BTC rejection sparks pullback, ETH at risk of breakdown, XRP hints at deeper losses
- Bitcoin price slips below $80,000 on Friday after being rejected from the 200-day EMA earlier this week.
- Ethereum nears the key 50-day EMA at $2,264, a close below this level could trigger an extended pullback.
- XRP momentum indicators turn bearish, suggesting the risk of a downside move.
Bitcoin (BTC), Ethereum (ETH), and Ripple (XRP) are showing signs of near-term weakness as key technical resistance comes into play. BTC faced rejection at its 200-day EMA earlier this week and has slipped below the $80,000 mark on Friday. ETH, on the other hand, is drifting toward a critical support level, where a breakdown could accelerate losses. XRP also paints a cautious picture, with momentum indicators turning bearish and hinting at a potential deeper correction ahead.
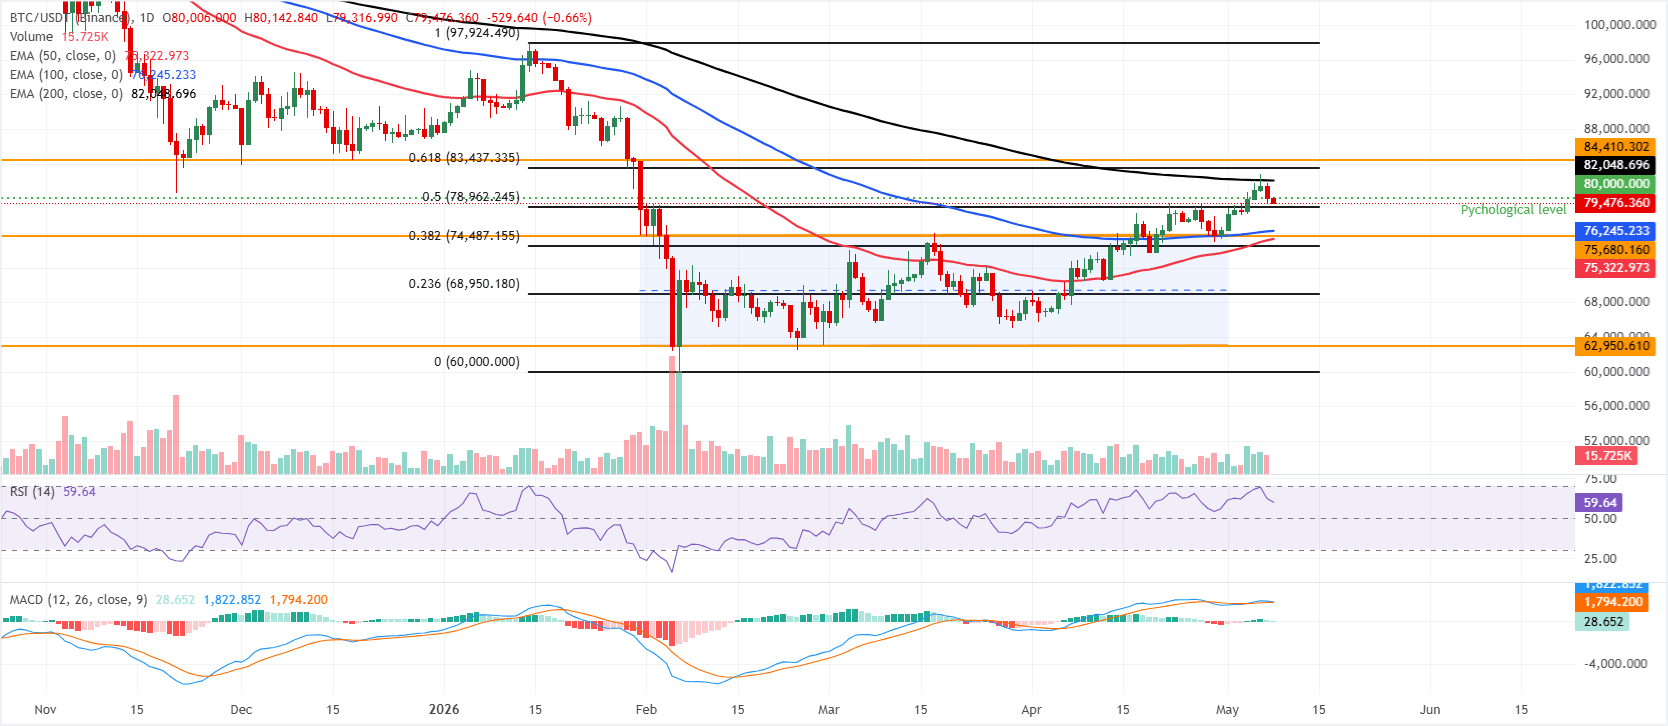
Bitcoin loses strength below the key 200-day EMA
Bitcoin is trading below $79,500 on Friday after being rejected by the 200-day Exponential Moving Average (EMA) at $82,048. However, BTC is holding a bullish near-term bias, as price sits above the 50-day and 100-day EMAs, clustered around $75,300–$76,300, and comfortably above the 50% retracement at $78,962.
The Crypto King is, however, approaching a nearby cap at the horizontal barrier of $80,000, while the 200-day EMA is at $82,048 and the 61.8% Fibonacci level is at $83,437, forming a broader resistance band above.
Momentum remains constructive, with the Relative Strength Index (RSI) holding near 59 and the Moving Average Convergence Divergence (MACD) line still marginally positive, suggesting buyers retain control but with fading follow-through.
On the downside, initial support is now aligned at the reclaimed 50% retracement at $78,962, ahead of a dense demand zone where the 100-day EMA at $76,245 converges with the former channel top near $75,680, and the 50-day EMA at $75,322.72.
A break below this band would expose deeper retracements toward the 38.2% Fibonacci level at $74,487 and then the 23.6% Fibonacci retracement at $68,950, while sustained trade above $80,000 would open the way toward the 200-day EMA at $82,048 and the $84,410 resistance, with the cycle high near $97,924 remaining the broader bullish objective.
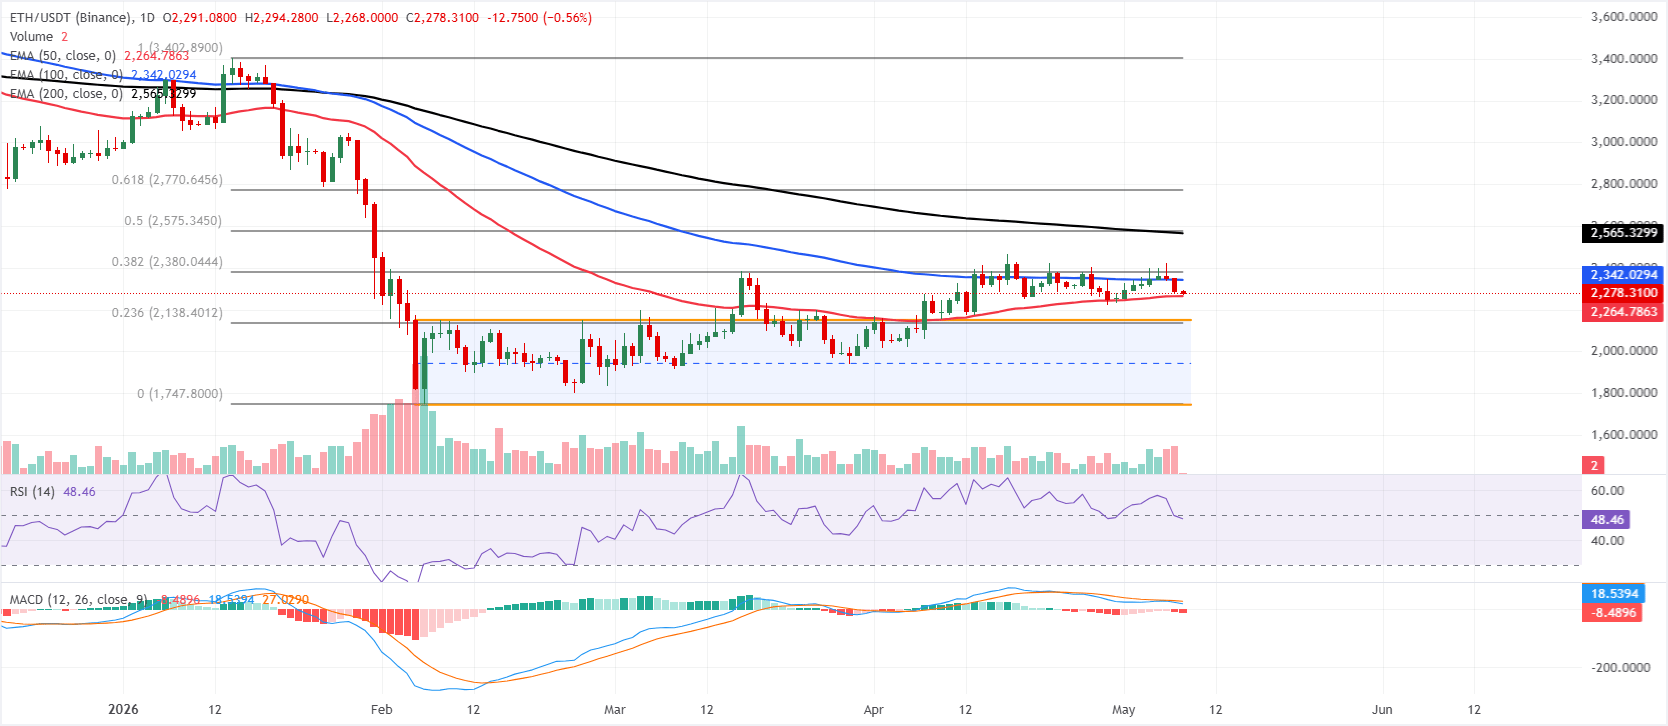
Ethereum clings to 50-day EMA support
Ethereum price is trading at $2,275 on Friday, holding just above the 50-day EMA at $2,264 but remains capped well below the 100-day EMA at $2,342 and the 200-day EMA at $2,565, leaving the near-term tone broadly neutral within a broader corrective structure.
The RSI on the daily chart sits around 48, pointing to lackluster momentum, while the MACD remains in negative territory, with a declining line and a weak histogram, suggesting that bullish attempts may struggle while ETH trades below the higher daily averages and key Fibonacci retracements.
On the topside, initial resistance is seen at the 100-day EMA near $2,342, followed by the 38.2% Fibonacci retracement of the broader upswing at $2,380, with stronger barriers clustered higher at the 200-day EMA around $2,565 and the 50% retracement at $2,575; above these, the 61.8% level at $2,770 and the 78.6% retracement near $3,048 would come into focus.
On the downside, immediate support is provided by the 50-day EMA at $2,264, ahead of a structural band formed by the former channel top around $2,148 and the 23.6% retracement at $2,138, while a break of that region would expose the channel base and major swing low near $1,747.
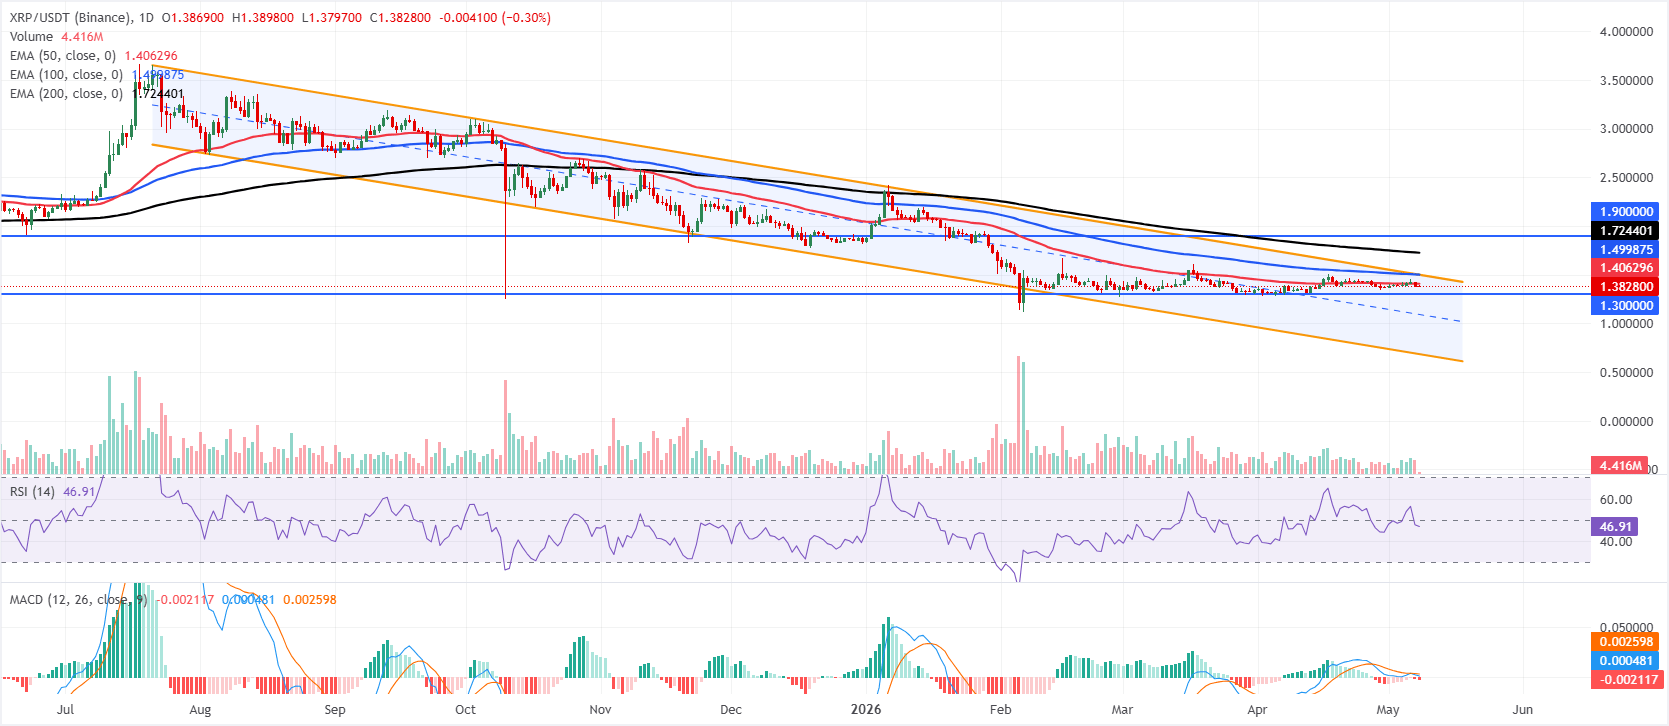
XRP momentum weakens, signaling downside risks
XRP price is trading at $1.38 on Friday, keeping a bearish near-term tone as it holds beneath the 50-day EMA at $1.40 and the longer-term 100-day and 200-day EMAs at $1.49 and $1.72, respectively. Price action remains contained within a broader downward-sloping channel, while the RSI is near 47, and a slightly negative MACD both hint at subdued bullish momentum and limited upside follow-through for now.
On the topside, initial resistance emerges at the 50-day EMA around $1.40, with the upper boundary of the descending channel near $1.49 and the 100-day EMA at $1.49 forming a congested supply zone ahead of the 200-day EMA at $1.72; a more distant hurdle is seen at the horizontal resistance near $1.90.
On the downside, immediate support is aligned with the horizontal level at $1.30, while a deeper slide would expose the channel's lower boundary around $0.68 as the next major bearish objective.
(The technical analysis of this story was written with the help of an AI tool.)
Cryptocurrency metrics FAQs
The developer or creator of each cryptocurrency decides on the total number of tokens that can be minted or issued. Only a certain number of these assets can be minted by mining, staking or other mechanisms. This is defined by the algorithm of the underlying blockchain technology. On the other hand, circulating supply can also be decreased via actions such as burning tokens, or mistakenly sending assets to addresses of other incompatible blockchains.
Market capitalization is the result of multiplying the circulating supply of a certain asset by the asset’s current market value.
Trading volume refers to the total number of tokens for a specific asset that has been transacted or exchanged between buyers and sellers within set trading hours, for example, 24 hours. It is used to gauge market sentiment, this metric combines all volumes on centralized exchanges and decentralized exchanges. Increasing trading volume often denotes the demand for a certain asset as more people are buying and selling the cryptocurrency.
Funding rates are a concept designed to encourage traders to take positions and ensure perpetual contract prices match spot markets. It defines a mechanism by exchanges to ensure that future prices and index prices periodic payments regularly converge. When the funding rate is positive, the price of the perpetual contract is higher than the mark price. This means traders who are bullish and have opened long positions pay traders who are in short positions. On the other hand, a negative funding rate means perpetual prices are below the mark price, and hence traders with short positions pay traders who have opened long positions.
추천 기사


