

Bitcoin Price Forecast: BTC hits three-month high on derivatives-led surge


Bitcoin price surges above $80,000 on Monday, the highest level since the end of January.
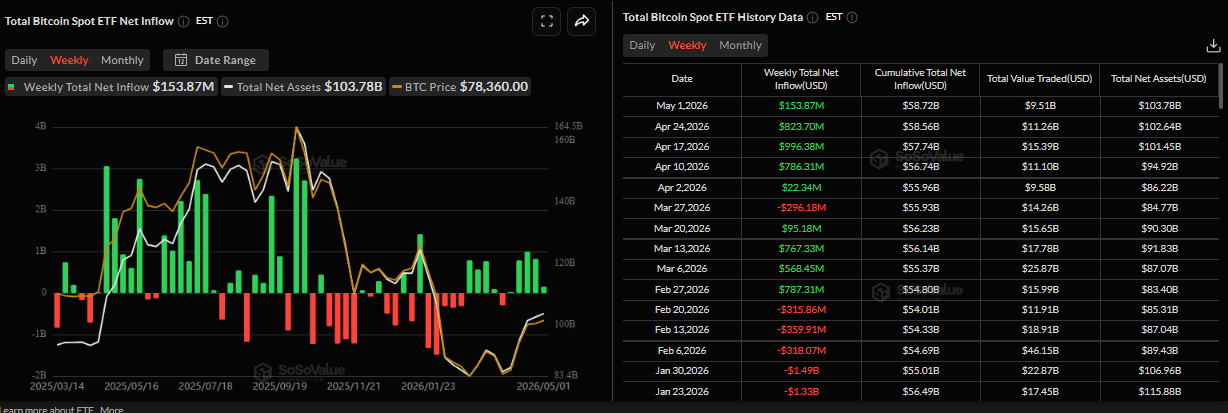
US-listed spot ETF recorded inflows of $153.87 million last week, marking the fifth consecutive week of positive flows.
Traders should be cautious, as the BTC price surge is driven by perpetual futures demand while spot markets remain in contraction.
Reports highlight that the current market structure is more speculative than fundamental, mirroring the pattern seen at the onset of the 2022 bear market.
Bitcoin (BTC) price surges above $80,000 on Monday, reaching the highest level since the end of January. Institutional demand supports this price surge, as spot Exchange Traded Funds (ETFs) recorded inflows of over $153 million last week, marking the fifth consecutive week of positive flows. Meanwhile, the Crypto King is near a key psychological level. Analysts noted that the current market structure is more speculative than fundamental, mirroring the pattern seen at the onset of the 2022 bear market.
Institutional demand remains robust
Bitcoin’s price continues its rally, reaching a high of $80,635 on Monday after a mild consolidation the previous week. Institutional demand supports the price surge, as it remains robust. SoSoValue data show that BTC spot ETFs recorded an inflow of $153.87 million last week, marking the fifth consecutive weekly inflow since early April. If this trend continues this week, BTC could see a further price rally.
Derivatives-driven surge
CryptoQuant’s weekly report last week highlighted that the Bitcoin price surge in April was driven entirely by growth in perpetual futures demand.
The chart below shows that the recent price surge in the Crypto King was more of a speculative rally than a fundamental one, as spot demand remained contracted.
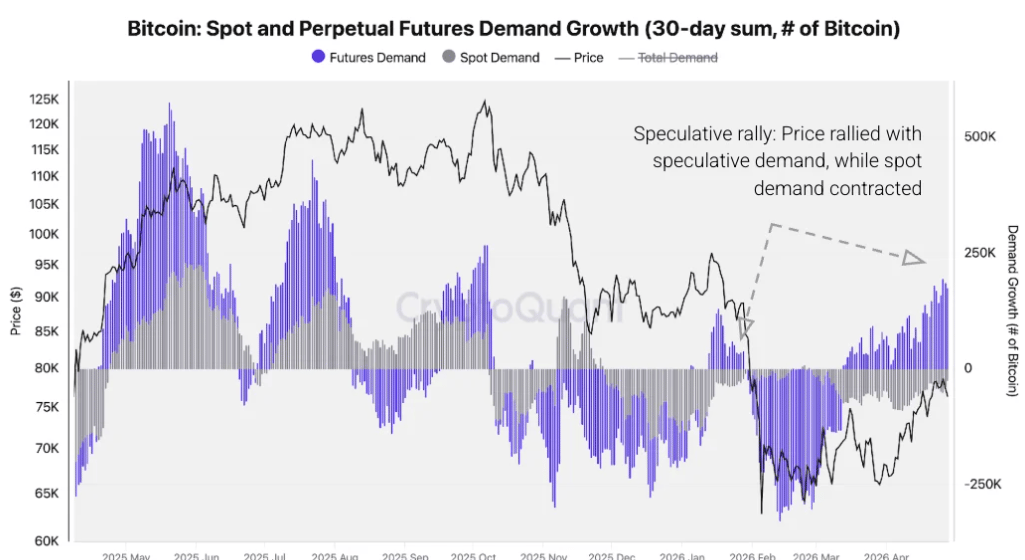
“Perpetual futures demand was the sole driver of Bitcoin’s April price rally, while spot apparent demand contracted throughout, a configuration historically associated with unsustained price gains during bear markets,” noted the CryptoQuants’ analyst.
“This divergence—rising futures demand alongside contracting spot demand—suggests price appreciation is driven by leverage rather than fresh coin accumulation. Historically, such configurations lack the structural foundation required to sustain price gains and typically resolve via correction once futures positioning unwinds,” he added.
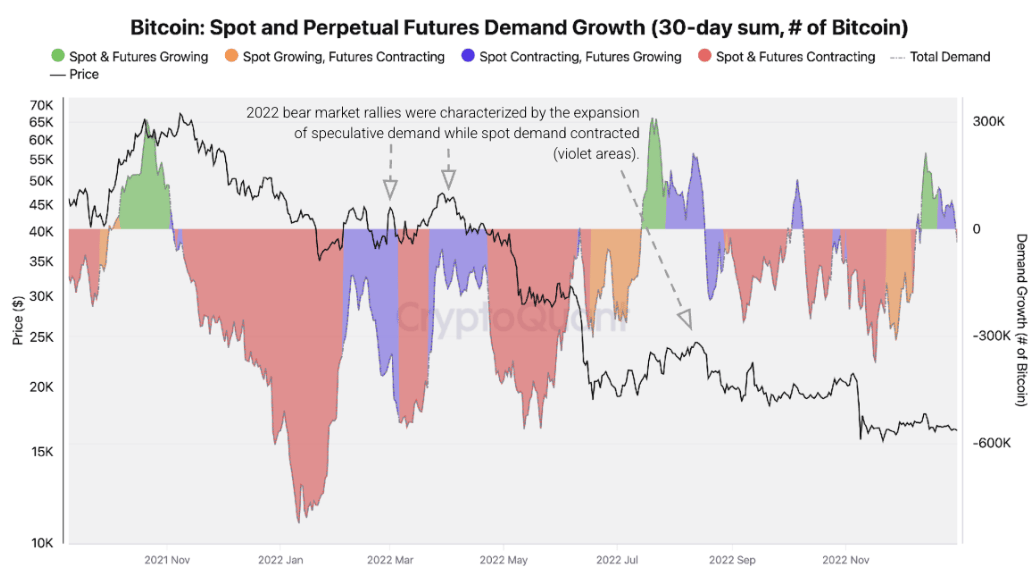
Current market structure mirrors the onset of the 2022 bear market
The current market structure mirrors the pattern seen at the onset of the 2022 bear market, when perpetual futures demand surged in isolation while spot demand contracted simultaneously, a configuration that preceded a sustained multi-month price decline.
The analyst concluded that, “The similarity does not guarantee an identical outcome, but it establishes that the current demand structure is consistent with historically bearish precedent. On-chain demand decomposition, applied consistently across cycles, identifies this pattern as a reliable early indicator of price fragility.”
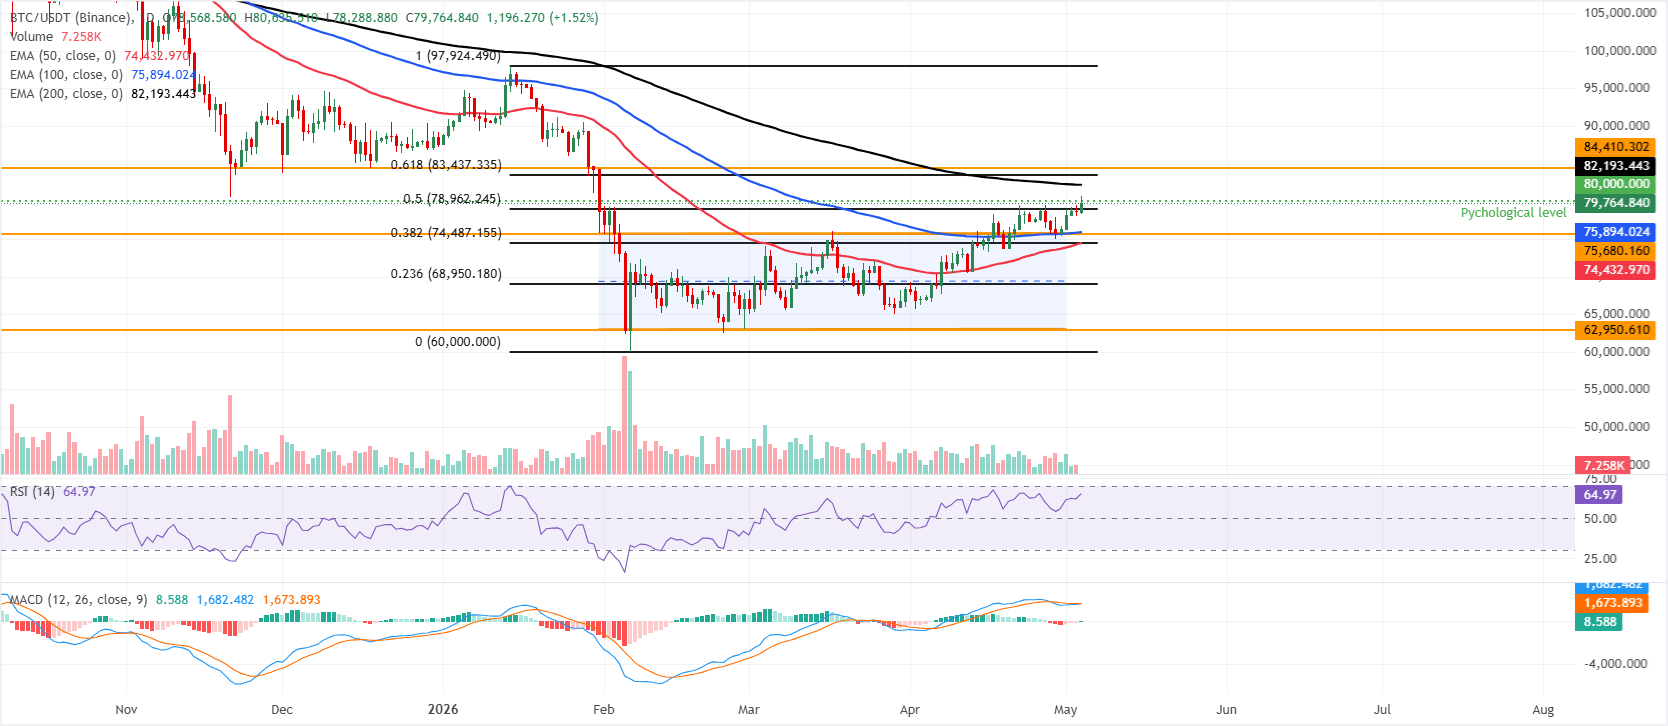
Bitcoin Price Forecast: BTC surge to key psychological level
Bitcoin is trading above $79,700 at the time of writing on Monday, maintaining a bullish near-term bias as it consolidates above the 50- and 100-day Exponential Moving Averages (EMAs), clustered around the mid-$70,000s.
BTC is also trading above the 50% retracement (drawn from January high to the February low) at roughly $78,962 and the top of the horizontal parallel channel near $75,680, suggesting the broader uptrend remains supported, while a firm Relative Strength Index (RSI) on the daily chart around 65 and a recovering Moving Average Convergence Divergence (MACD) reading hint that upside momentum is still constructive.
On the topside, immediate resistance is located at the psychological $80,000 level, followed by the 200-day EMA near $82,193 and the 61.8% Fibonacci retracement around $83,437, ahead of a higher horizontal barrier at about $84,410.
On the downside, initial support is seen at the 50% retracement at $78,962, with additional demand expected around the upper channel boundary near the level at $75,680, reinforced by the 100-day EMA just under $75,900. Deeper pullbacks would expose the 38.2% Fibonacci retracement and 50-day EMA in the $74,432-$74,487 area before the broader channel floor and major support zone around $63,000.
(The technical analysis of this story was written with the help of an AI tool.)
면책사항: 본문의 내용은 편집자의 개인관점이며, Mitrade의 공식입장을 대표하지 않으며, 투자 권유 또는 제안의 목적이 아닙니다. 글의 내용은 단지 참고용이며, 독자는 본문의 내용을 어떠한 투자의 근거로 삼아서는 안됩니다. Mitrade는 이 글에 근거한 어떠한 거래 결과에 대해서도 책임을 지지 않습니다. Mitrade는 이 글의 정확성을 보증하지 않습니다. 투자 결정을 하기 전에 반드시 위험을 숙지할 수 있도록 독립적인 재무 상담사의 조언을 구해야 합니다.
차액 결제 거래(CFD)는 레버리지 상품이며, 귀하의 투자 원금 손실이 발생할 수 있습니다. CFDs 거래는 모든 사람에게 적합하지 않을 수 있습니다. 신중하게 투자하시기 바랍니다.


