

Ethereum Weekly Forecast: ETH rebounds from key support despite macro headwinds
- Ethereum extends recovery after finding support around a key level, still down 3.5% so far this week.
- US-listed ETH ETFs recorded outflows of $183.65 million through Thursday, pointing to a break in the three consecutive positive flows weekly streak.
- Fed’s hawkish hold and Powell’s remarks, coupled with uncertainty around US-Iran peace talks, dampen risk appetite, limiting ETH’s upside potential.
Ethereum (ETH) shows signs of recovery, trading above $2,280 on Friday after finding support at a crucial level, offering some relief following 3.5% decline so far this week. However, fading institutional demand, alongside the Federal Reserve’s (Fed) hawkish tone and uncertainty around the US-Iran peace talks, continues to pressure risk sentiment. This combination leaves ETH traders cautious in a situation where a sustained rebound or further downside move could define its near-term trend.
Hawkish Fed and US-Iran war weigh on ETH
Ethereum extended its correction mid-week, printing three consecutive days of losses and closed below $2,260 on Wednesday. This price pullback came amid the Fed’s hawkish tilt and the US-Iran stalemate, which favors the US Dollar (USD) bulls and keeps a lid on risk-sensitive assets such as ETH.
The Fed decided to keep the interest rate unchanged at the 3.50%-3.75% range at its April meeting on Wednesday, as widely expected by market participants. Notably, the decision saw the highest number of dissents since 1992, with three policymakers voting against the accommodative tone in the policy statement, while another one dissented in favor of a rate cut.
In the post-meeting press conference, the outgoing Fed Chair Jerome Powell clarified that the debate was about the neutrality of the tone and not the need to hike interest rates. Traders, however, sharply reduced bets on any further Fed easing in 2026 and are now pricing in an over 10% chance of a rate increase by December, as per the CME FedWatch tool.
The decision comes at a time when the war-driven surge in energy prices has been fueling inflationary concerns amid stalled US-Iran peace talks. Uncertainty over the second round of negotiations in the Middle East conflict has emerged as a short-term factor capping the upside momentum of risky assets, as geopolitical risks continue to dampen risk sentiment across markets.
However, the earnings report from big US tech companies on Thursday provides a mild boost to crypto markets, with Ethereum recovering slightly. As of Friday, ETH is continuing its recovery, trading above $2,280.
Institutional demand shows cautionary signs
Institutional demand for Ethereum remained cautious this week. SoSoValue data shows that ETH spot ETFs recorded an outflow of $183.65 million through Thursday. If these outflows continue on Friday, it would break a three-week run of consecutive inflows, which could put further downward pressure on Ethereum prices.
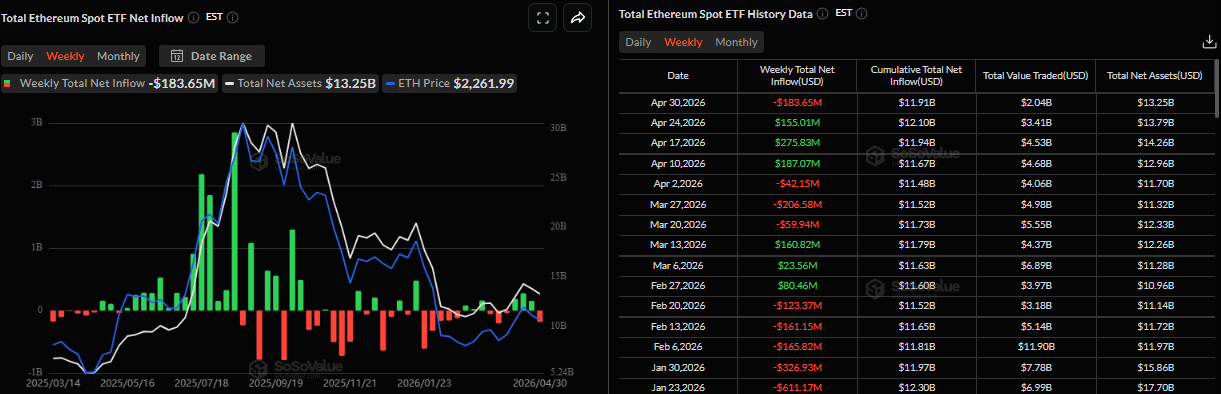
On the corporate side, Bitmine Immersion Technologies (BMNR) announced on Monday that Bitmine (crypto + total cash + “moonshots”) holdings totaled $13.3 billion.
“Bitmine ETH holdings crossed 5 million this past week,” stated Thomas “Tom” Lee, Chairman of Bitmine.
Lee continued, “This is a major milestone as the Company moves towards acquiring 5% of the ETH supply. And this pace of accumulation is astonishing, taking only 10 months to reach 5 million.”
Mixed sentiment on derivatives markets
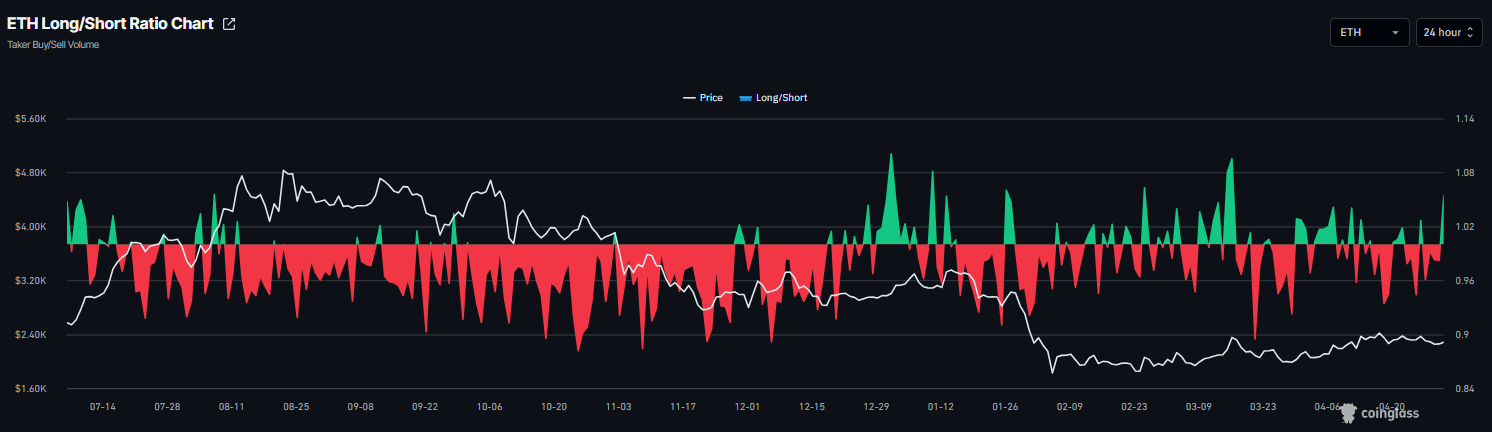
Derivatives data shows mixed sentiment among the traders. CoinGlass’ long-to-short ratio for ETH reads 1.03 on Friday, nearing the highest level over a month. This ratio, being above one, reflects bullish sentiment in the market, as more traders are betting on the asset’s price to rise.
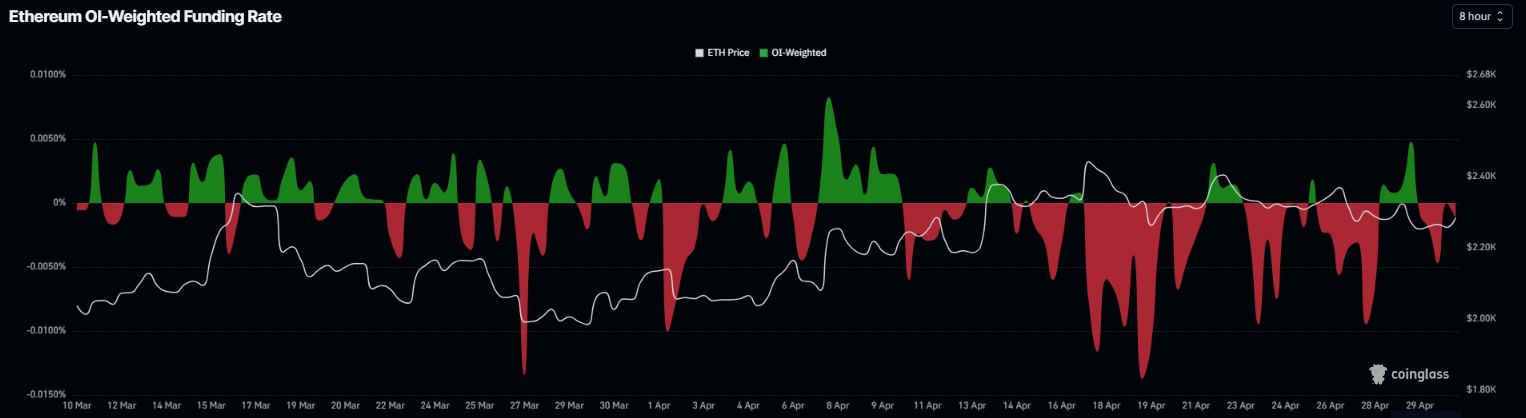
However, the funding rates support a bearish bias. CoinGlass’ OI-Weighted Funding Rate data for ETH flipped negative on Wednesday and remains negative, reading -0.0012% on Friday. This negative rate indicates that shorts are paying the longs, suggesting bearish sentiment.
This combination suggests indecision among ETH investors and a lack of clear directional bias, which limits the chances of a sustained recovery.
What’s there for Ethereum in May?
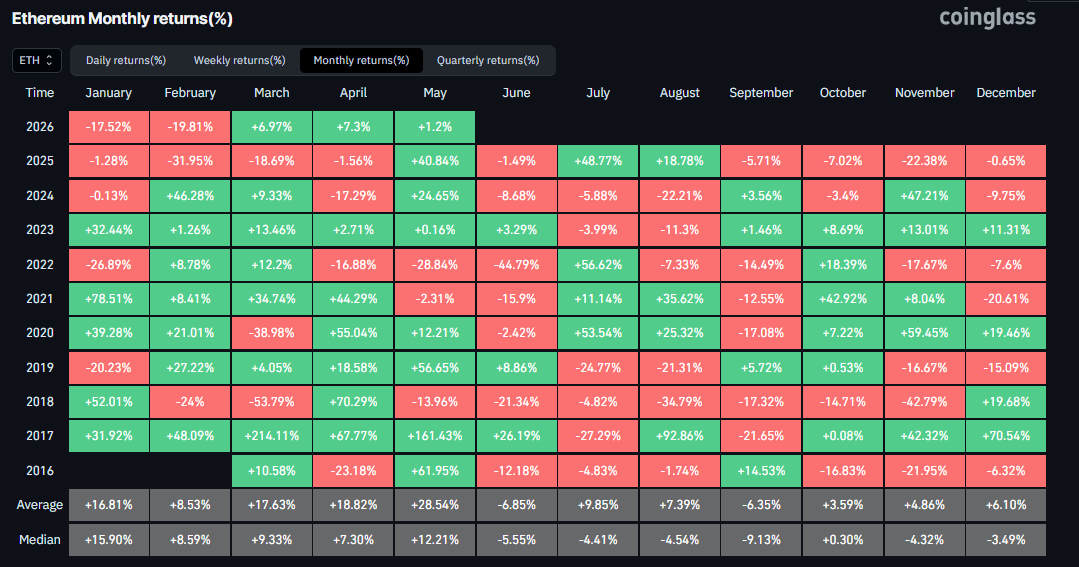
Ethereum’s price closed April with a 7.3% positive return, marking the second consecutive monthly gains so far this year, as shown in the chart below.
However, monthly trends suggest some signs of optimism. Historically, Ethereum has delivered positive returns in May, averaging gains of 28.54%. This recovery thesis would play in if institutional inflows resume, regulatory developments turn supportive for the broader crypto market, and the war in the Middle East comes to an end, which could restore investor confidence and risk appetite.
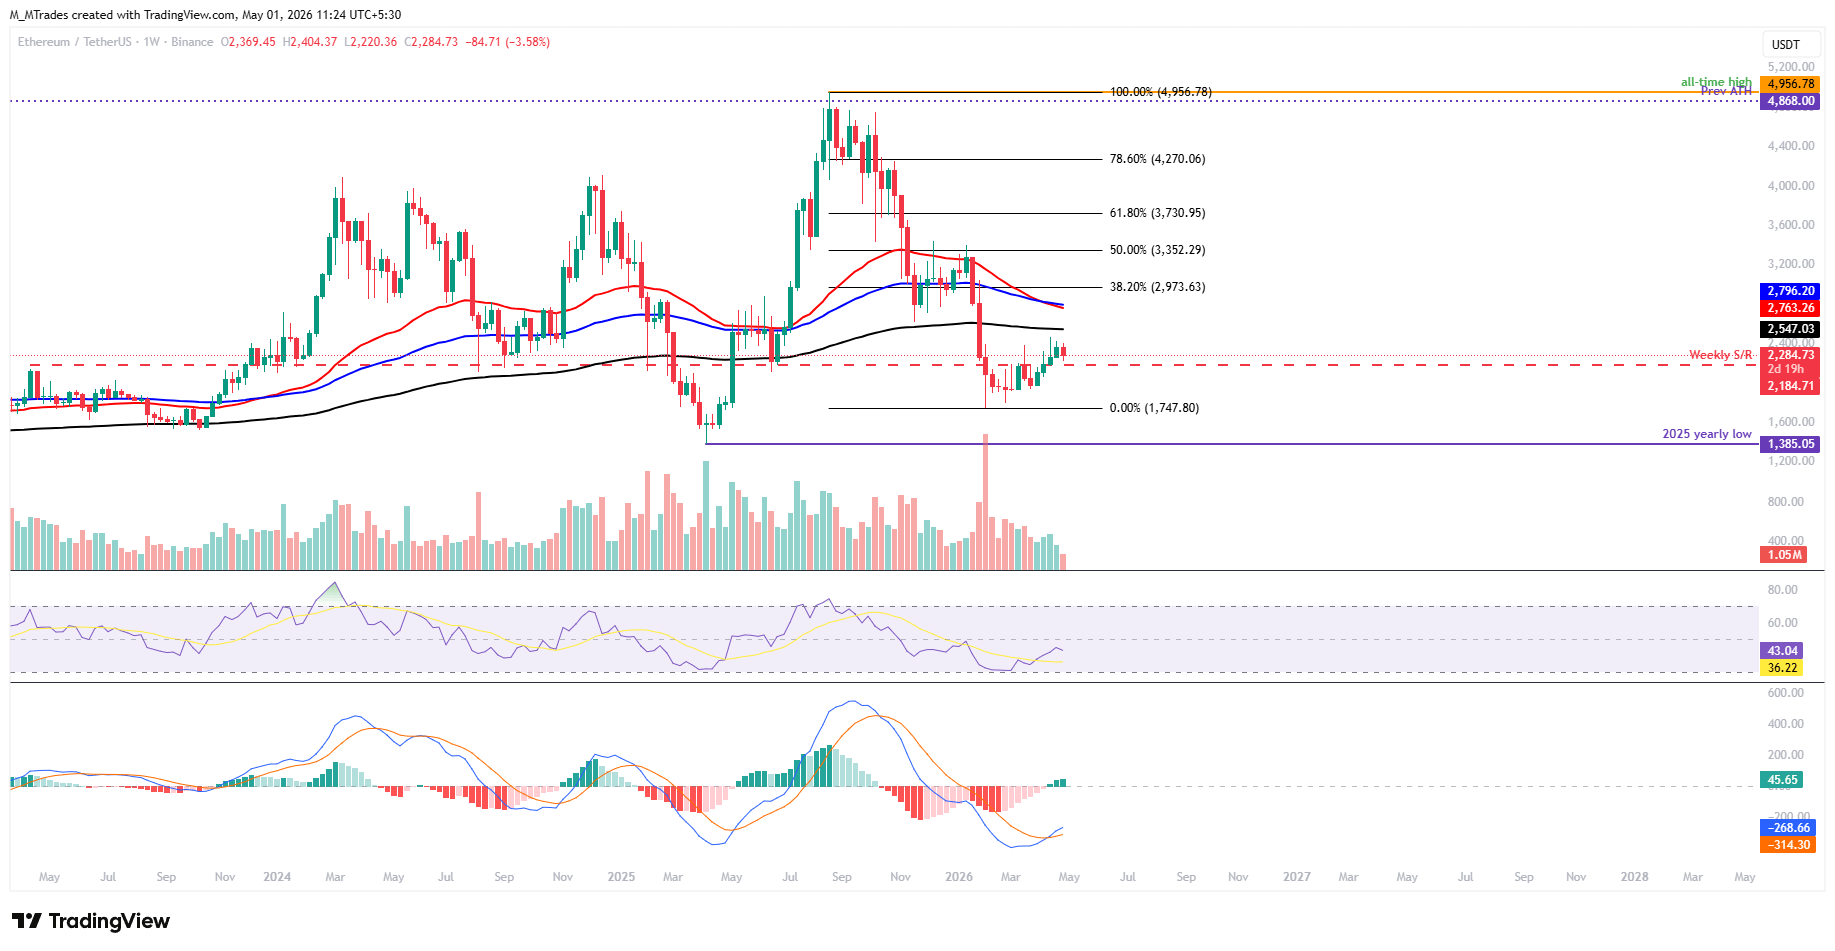
Technical outlook: Key support holds strong
On the weekly chart, the second-largest cryptocurrency by market capitalization corrected 3.5% so far this week, trading at $2,280 on Friday.
If BTC finds support around the previous broken weekly support at $2,184 and resumes its recovery, it could extend the gains toward the 200-Week Exponential Moving Average (EMA) at $2,547.
The Relative Strength Index (RSI) reads 43 on the weekly chart, pointing upward toward the neutral 50 level after recovering from oversold territory, suggesting fading bearish momentum. The Moving Average Convergence Divergence (MACD) indicator on the same chart showed a bullish crossover in mid-April that is still in place, with rising green histogram bars supporting the bullish thesis.
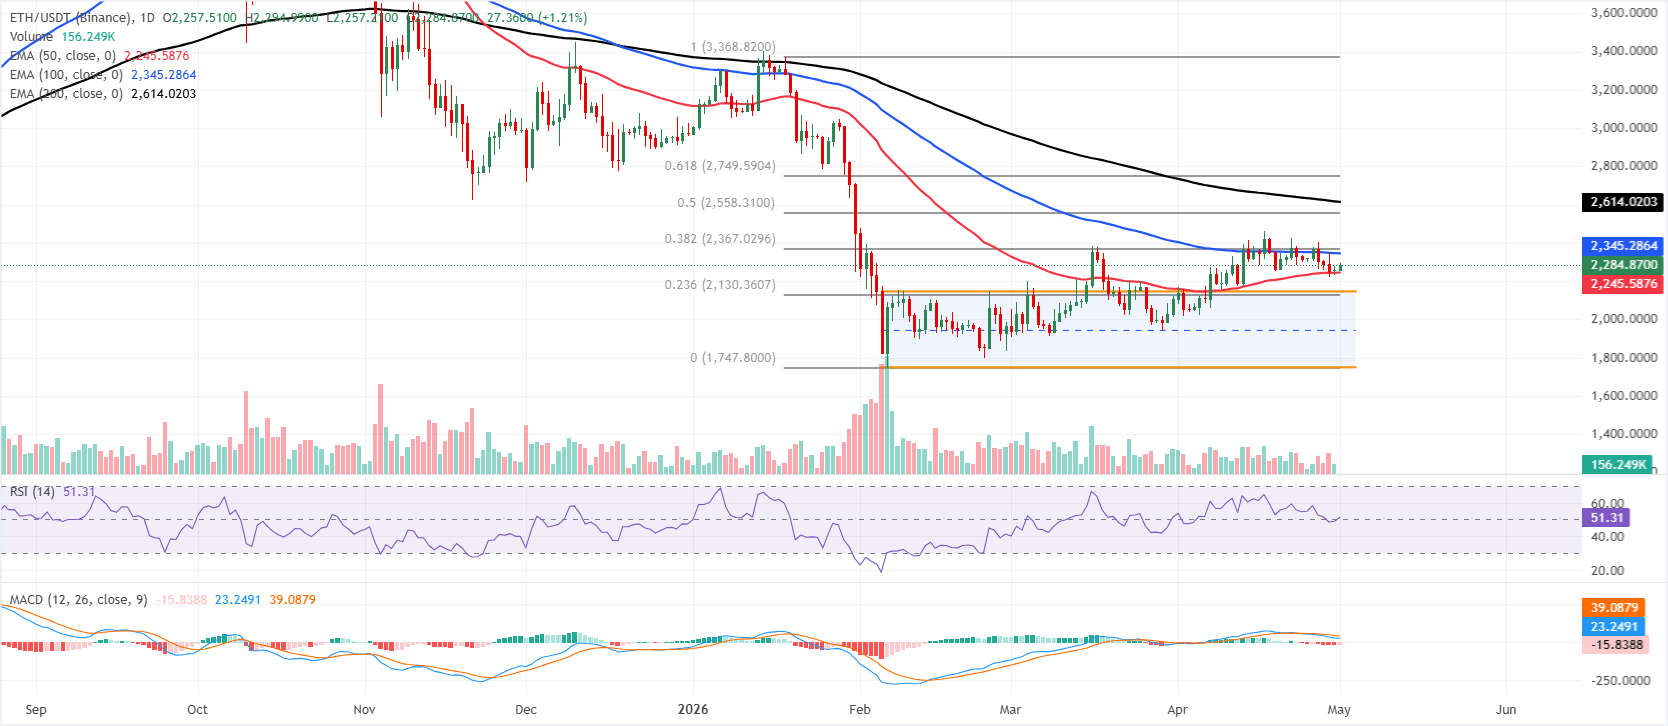
On the daily chart, Ethereum is holding just above the 50-day EMA at $2,245 but still capped well below the 100-day EMA at $2,345 and the 38.2% Fibonacci retracement (drawn from the January high to the February low) at $2,367. This configuration suggests a neutral to slightly capped tone within the broader horizontal parallel channel, as price trades above the former channel top at $2,148, yet lacks the strength to challenge the higher retracement band.
Momentum is mixed, with the RSI on the daily chart hovering near a neutral 50, while the MACD remains negative, hinting at waning upside pressure despite holding over the short-term EMA support.
On the downside, initial support is seen at the 50-day EMA near $2,245, with additional protection from the prior channel ceiling at $2,148 and the 23.6% Fibonacci retracement at $2,130 Abreak beneath this cluster would expose the channel base near $1,747.
On the topside, bulls face their first significant hurdle at the 100-day EMA at $2,345, followed by the 38.2% retracement at $2,367. A sustained move above these barriers would open the way toward the 50% retracement at $2,558 and then the 200-day EMA at $2,614, with the 61.8% retracement level at $2,749 marking a more distant objective.
(The technical analysis of this story was written with the help of an AI tool.)
Ethereum FAQs
Ethereum is a decentralized open-source blockchain with smart contracts functionality. Its native currency Ether (ETH), is the second-largest cryptocurrency and number one altcoin by market capitalization. The Ethereum network is tailored for building crypto solutions like decentralized finance (DeFi), GameFi, non-fungible tokens (NFTs), decentralized autonomous organizations (DAOs), etc.
Ethereum is a public decentralized blockchain technology, where developers can build and deploy applications that function without the need for a central authority. To make this easier, the network leverages the Solidity programming language and Ethereum virtual machine which helps developers create and launch applications with smart contract functionality.
Smart contracts are publicly verifiable codes that automates agreements between two or more parties. Basically, these codes self-execute encoded actions when predetermined conditions are met.
Staking is a process of earning yield on your idle crypto assets by locking them in a crypto protocol for a specified duration as a means of contributing to its security. Ethereum transitioned from a Proof-of-Work (PoW) to a Proof-of-Stake (PoS) consensus mechanism on September 15, 2022, in an event christened “The Merge.” The Merge was a key part of Ethereum's roadmap to achieve high-level scalability, decentralization and security while remaining sustainable. Unlike PoW, which requires the use of expensive hardware, PoS reduces the barrier of entry for validators by leveraging the use of crypto tokens as the core foundation of its consensus process.
Gas is the unit for measuring transaction fees that users pay for conducting transactions on Ethereum. During periods of network congestion, gas can be extremely high, causing validators to prioritize transactions based on their fees.
추천 기사


