

Bitcoin Price Forecast: BTC shows signs of resilience as ETF inflows extend
- Bitcoin price finds support around the mid-point of a horizontal consolidation channel on Thursday, rebounding nearly 6% so far this week.
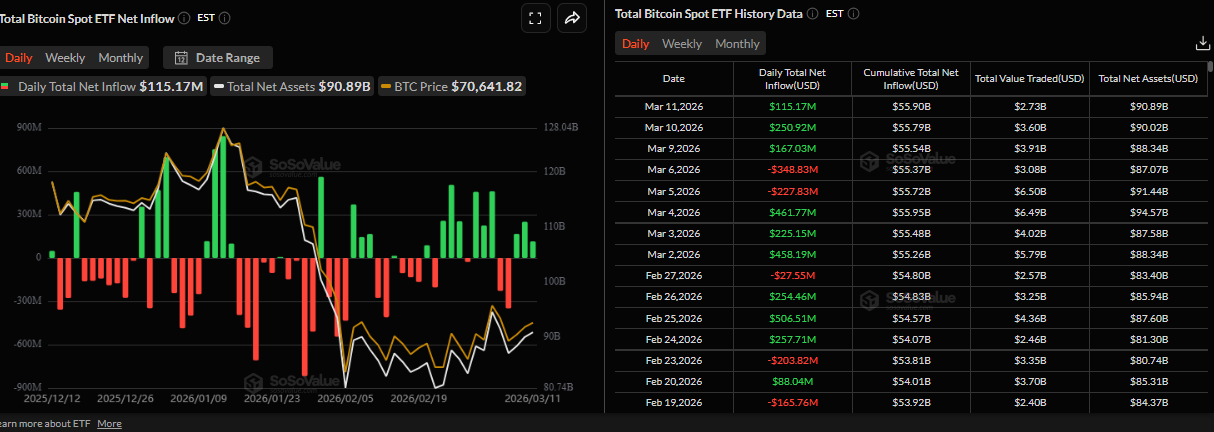
- US-listed spot ETFs recorded an inflow of over $115 million on Wednesday, marking the third consecutive day of positive flows this week.
- Analysts at Nansen say Bitcoin is showing relative resilience, holding up better than several traditional risk benchmarks.
Bitcoin (BTC) price finds support around a key level, trading around $70,000 as of writing on Thursday and posting gains of nearly 6% so far this week. Institutional demand shows signs of strength, as spot Exchange Traded Funds (ETFs) recorded a third consecutive day of inflows this week. Meanwhile, Nansen’s analyst reports the Crypto King is showing relative resilience, holding up better than several traditional risk benchmarks.
Bitcoin shows signs of resilience
Bitcoin’s price has remained resilient so far this week amid rising tensions between the US and Iran.
A Research Analyst at Nansen told FXStreet that Bitcoin has shown relative resilience, holding up better than several traditional risk benchmarks. For example, the Euro Stoxx 50 declined more sharply during the session, suggesting that selling pressure in Bitcoin remains comparatively limited despite lingering geopolitical uncertainty.
The analyst noted that “Across the rest of the crypto market, altcoins continue to behave largely as a higher-beta extension of bitcoin. If the broader crypto market finds a bottom, alts are likely to outperform on the upside, but the reverse also holds if BTC weakens further.“
Nansen’s analyst also said that "traders are closely watching signals from Iran that could signal a willingness to end the conflict, with oil futures likely serving as the most immediate market indicator of any shift in the geopolitical outlook".
When asked about the price forecast for Bitcoin, the Nasen team predicted that "the market has been ranging between $60,000 and $71,000 for weeks now, and we are sitting near the top of that range without a clean break above it. Until $71,000 is held with follow-through, this level acts as resistance rather than a launchpad. That is still the case, even though BTC has risen slightly over the past few days."
Institutional demand remains robust for Bitcoin
Institutional demand has remained strong so far this week. According to SoSoValue data, spot Bitcoin ETFs recorded inflows of $115.17 million on Wednesday, marking the third consecutive day of positive flows this week. If these inflows continue and intensify, BTC could see a further recovery in the upcoming days.
Bitcoin Price Forecast: BTC finds support around a key technical level
Bitcoin is trading around $70,000 as of writing on Thursday, holding above the midpoint of a horizontal channel at $69,000. The Crypto King has rebounded nearly 6% so far this week. However, the near-term tone stays cautiously bearish within the parallel channel, as price hovers closer to the upper boundary near $72,600 than to the floor around $65,900. BTC remains well below the 50-day and 100-day Exponential Moving Averages (EMAs), at $72,928 and $80,050, respectively, which continue to cap the broader trend and frame the current recovery as a counter-move within a larger downphase.
The Relative Strength Index (RSI) on the daily chart at 51 shows momentum stabilizing around the neutral line rather than signaling strong upside follow-through, while the Moving Average Convergence Divergence (MACD) line, which is holding above the signal line, hints at improving bullish momentum.
Immediate support is located near the channel base around $65,900, where prior lows and the lower boundary align. A break below this area would expose deeper downside toward the $60,000 region.
On the topside, initial resistance sits at the recent swing high and channel cap near $72,600. A daily close above this ceiling would signal a bullish breakout from the consolidating structure and open the way toward the $75,000–$76,000 area.
As long as BTC remains trapped between $65,900 support and $72,600 resistance inside the channel, rallies face selling pressure, and the broader downside bias stays intact despite the recent improvement in momentum gauges.
(The technical analysis of this story was written with the help of an AI tool.)
Bitcoin, altcoins, stablecoins FAQs
Bitcoin is the largest cryptocurrency by market capitalization, a virtual currency designed to serve as money. This form of payment cannot be controlled by any one person, group, or entity, which eliminates the need for third-party participation during financial transactions.
Altcoins are any cryptocurrency apart from Bitcoin, but some also regard Ethereum as a non-altcoin because it is from these two cryptocurrencies that forking happens. If this is true, then Litecoin is the first altcoin, forked from the Bitcoin protocol and, therefore, an “improved” version of it.
Stablecoins are cryptocurrencies designed to have a stable price, with their value backed by a reserve of the asset it represents. To achieve this, the value of any one stablecoin is pegged to a commodity or financial instrument, such as the US Dollar (USD), with its supply regulated by an algorithm or demand. The main goal of stablecoins is to provide an on/off-ramp for investors willing to trade and invest in cryptocurrencies. Stablecoins also allow investors to store value since cryptocurrencies, in general, are subject to volatility.
Bitcoin dominance is the ratio of Bitcoin's market capitalization to the total market capitalization of all cryptocurrencies combined. It provides a clear picture of Bitcoin’s interest among investors. A high BTC dominance typically happens before and during a bull run, in which investors resort to investing in relatively stable and high market capitalization cryptocurrency like Bitcoin. A drop in BTC dominance usually means that investors are moving their capital and/or profits to altcoins in a quest for higher returns, which usually triggers an explosion of altcoin rallies.
추천 기사


