

Pi Network Price Forecast: PI shows steady recovery on Kraken listing news
- Pi Network extends gains on Thursday, bringing its weekly advance to roughly 10% so far.
- Kraken announces that the PI token will be listed on its exchange on Friday.
- The technical outlook is bullish as PI sustains higher grounds ahead of its Kraken listing and Pi Day.
Pi Network is trading near $0.2300 at press time on Thursday, extending its weekly gains to roughly 10% so far. Data shows retail sentiment surrounding PI holds firm ahead of its listing on the Kraken exchange. The technical outlook for PI is bullish as buying pressure stays persistent.
Demand holds as PI listing on Kraken widens the window to the US market
Pi Network has maintained a broadly upward trend this month, with gains of more than 30% so far. The strong retail sentiment ahead of its first Open Network anniversary on February 20 started the recent recovery, and is holding steady ahead of the Kraken listing on Friday and Pi Day on Saturday.
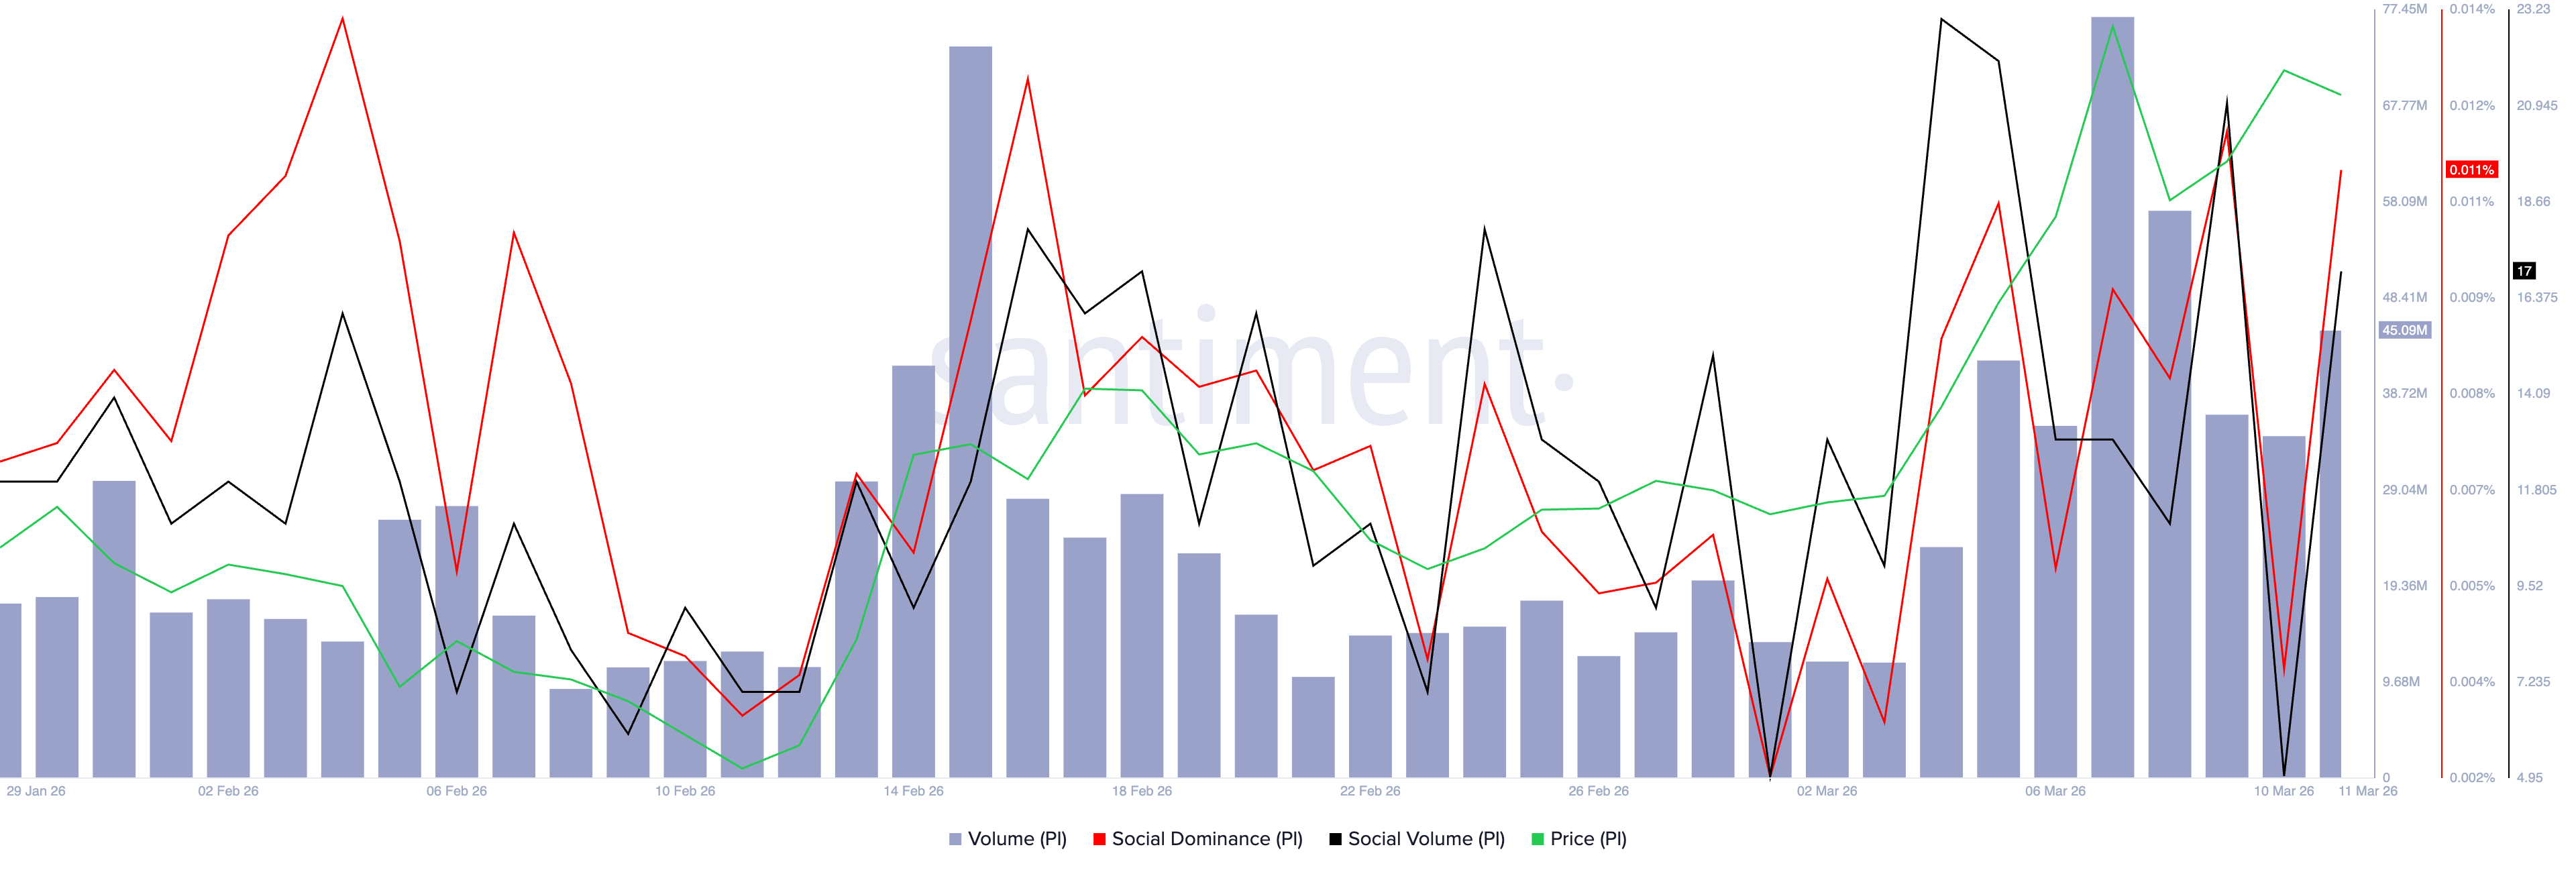
Santiment data shows a sharp recovery in Pi Network's social volume and social dominance score on Wednesday, reaching 17 mentions and 0.011% of the top 100 cryptocurrencies. Typically, a rebound in social metrics suggests renewed interest in retail interest, which increases the upside potential for Pi Network.
Kraken exchange officially announced the listing of the PI token in an X post on Thursday. Trading will commence on Friday, a day before Pi Day on March 14. The community is likely to pay close attention on both days, which could sustain retail demand.

Kraken becomes the second US-based exchange extending support to the PI token after OKX, while the token is also available on Seychelles and Cayman Islands-based exchanges such as MEXC, BitGet, and Gate.io. The expansion implies the core team’s direction to tap into the US market.
Technical outlook: Will Pi Network extend its rally?
Pi Network is up 2% at press time on Thursday, approaching the previous swing high at $0.2396 from Saturday. A decisive close above this level could confirm further upside for PI, paving the way to the 200-day Exponential Moving Average (EMA) at $0.2837, near the September 24 high at $0.2913. Beyond this level, the higher resistance for Pi Network lies at the August 30 high of $0.3984.
The near-term tone is bullish as PI holds above the 50-day and 100-day EMAs, which remain upward-sloping, inching closer to a Golden Cross. However, PI remains below the 200-day EMA, suggesting the broader trend remains to the downside despite the recent recovery phase.
The Moving Average Convergence Divergence (MACD) and signal line continue to rise above the zero line with a modest positive histogram, suggesting persistent but not aggressive bullish momentum. The Relative Strength Index (RSI) hovers at 68, close to overbought territory, suggesting upside momentum could slow without a consolidation.
Initial support for PI emerges at the $0.2000 psychological level, close to the 100-day EMA at $0.1989, followed by a deeper zone at the 50-day EMA at $0.1866.
(The technical analysis of this story was written with the help of an AI tool.)
추천 기사


