

Bitcoin Price Forecast: BTC nears $70,000 ahead of Strategy Q4 earnings
- Bitcoin price nears the $70,000 mark on Thursday, erasing all gains since Trump won the US presidential election.
- US-listed spot ETFs record a second consecutive day of outflows, signaling further weakness.
- Traders’ focus shifts to Strategy’s earnings report, with attention to any updates on its Bitcoin holdings and balance-sheet exposure amid the recent price decline.
Bitcoin (BTC) price extends losses, nearing the $70,000 level at the time of writing on Thursday, erasing all gains since crypto-friendly candidate Donald Trump won the US presidential election in November 2024. Institutional demand continues to fade, with spot Exchange Traded Funds (ETFs) recording multiple outflows so far this week. As selling pressure persists, attention now turns to Strategy’s (MSTR) Q4 earnings report on Thursday, which could influence near-term direction through any updates on corporate Bitcoin exposure.
Institutional demand continues to fade
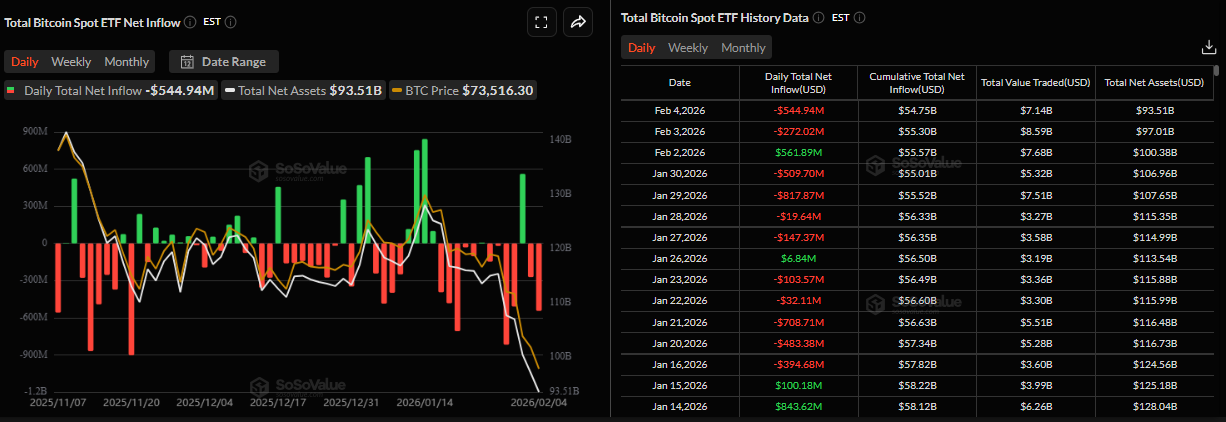
Institutional demand for Bitcoin continues to fade so far this week. According to the SoSovalue chart below, spot Bitcoin ETFs recorded an outflow of $544.94 million on Wednesday, marking the second consecutive day of withdrawals this week. If this outflow remains, BTC could see further price corrections.
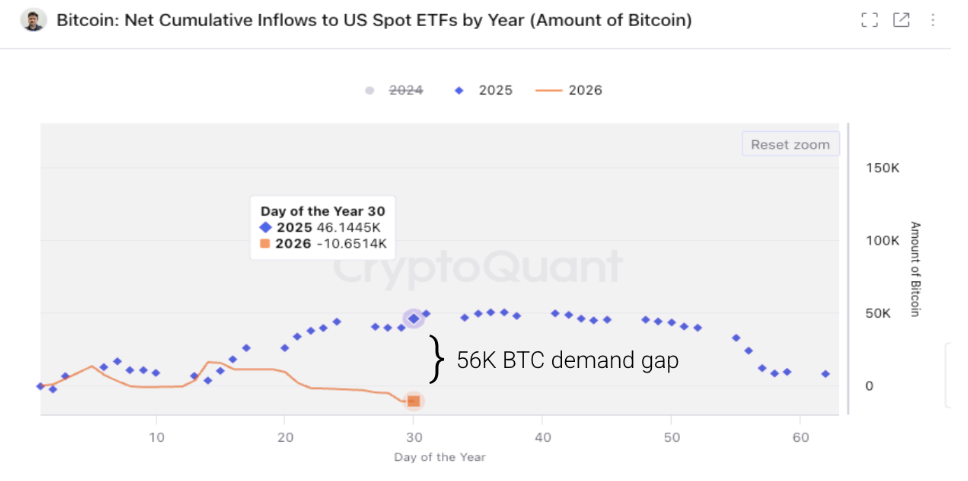
In addition, CryptoQuant’s weekly report on Wednesday highlighted that institutional demand for BTC has reversed materially. At this time last year, these ETFs had purchased 46,000 BTC on a net basis, contributing to Bitcoin demand growth. However, ETFs have been net sellers of Bitcoin so far in 2026, reducing their holdings by 10,600 BTC, leaving a 56,000 BTC gap versus last year. This has led to lower demand and greater selling pressure.
Strategy Q4 earnings could trigger some volatility
Strategy, the largest corporate holder of Bitcoin, with 713,502 BTC in its reserves, is scheduled to announce its Q4 earnings on Thursday. Investors remain on high alert, watching closely for any commentary on its Bitcoin strategy and balance-sheet exposure amid ongoing market volatility.
MSTR’s weekly chart below shows its stock price has nosedived by more than 73% from its 2025 high of $457.22, reaching a low of $121.19 on Wednesday, levels not seen since mid-September 2024.
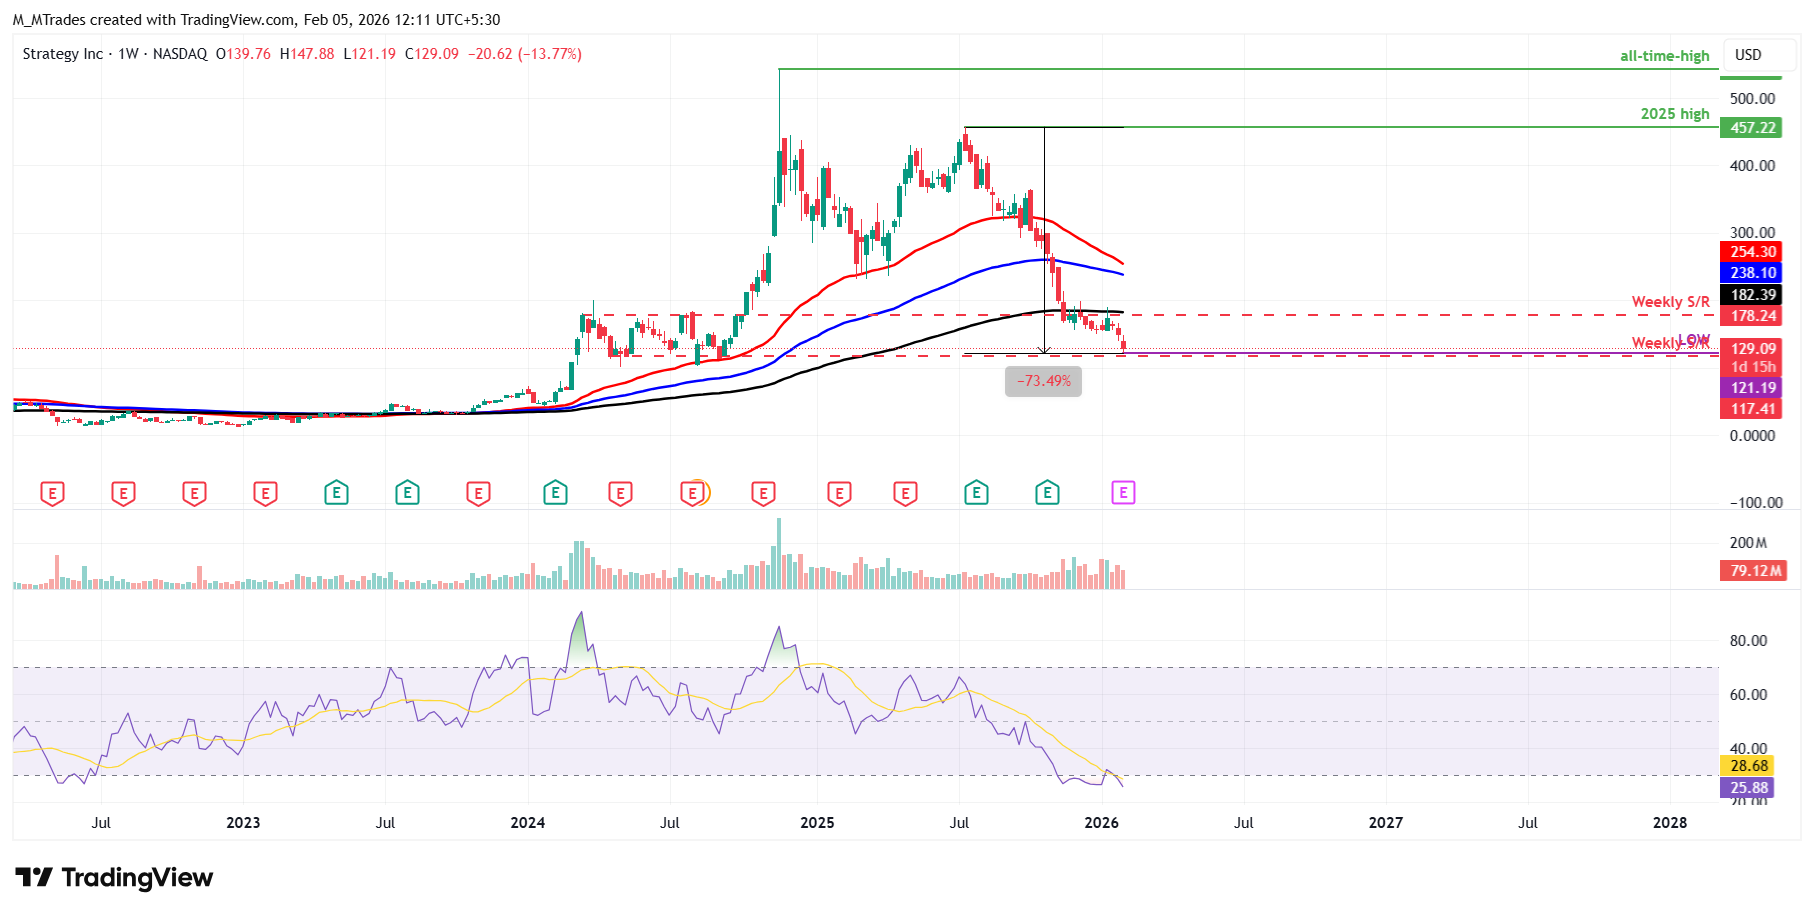
This price dip has caused several US public pension funds to incur significant losses (paper losses) from their investments in Strategy. Amid a decline in Bitcoin prices, these funds have seen their investments shrink by approximately $337 million, with 10 of 11 funds experiencing 60% losses, according to Wu Blockchain.
As explained in the previous report, the current NAV premium metric for MSTR, which measures how much the market values the company relative to the net value of its Bitcoin holdings and other assets, excluding liabilities, reads -18.50% (0.81x), implying the market values MSTR at 81% of the value of its Bitcoin holdings per share (excluding other business value).
This suggests that investors are currently unwilling to pay a premium for Strategy’s leveraged Bitcoin exposure, as concerns over dilution, rising debt costs, and Bitcoin’s recent price drop weigh on sentiment – making it harder for MSTR to raise low-cost capital for further BTC accumulation without pressuring shareholders.
Experts are bearish as BTC correction deepens
With Bitcoin’s sharp correction, nearly 8% this week, 19% year-to-date, and 44% from its all-time high of $126,199, it has turned many market experts increasingly bearish on BTC.
Ki Young Ju, founder of CryptoQuant, shares a chart on X, noting “Every Bitcoin analyst is now bearish.”
Veteran trader Peter Brandt also explained in an X post that Bitcoin’s recent decline, marked by eight consecutive days of lower highs and lower lows, bears the hallmarks of “campaign selling” rather than retail-driven liquidation. Brandt added that he has “seen this pattern hundreds of times over the decades,” cautioning that the timing of when such selling pressure exhausts itself remains uncertain.
In addition, Stifel, an independent investment bank, says Bitcoin could fall to $38,000 based on past cycles, citing tighter Fed policy, slowing US crypto regulation, shrinking liquidity, and heavy ETF outflows.
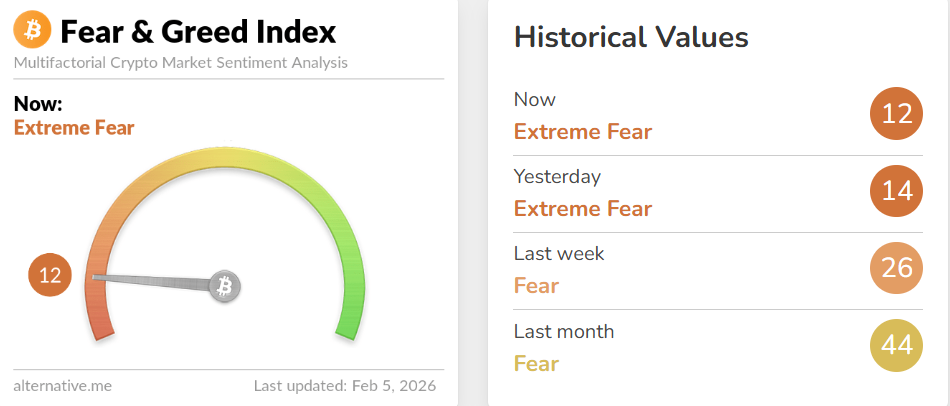
The sentiment chart shown below has sunk into “extreme fear,” showing waning institutional and retail interest.
BTC decoupling from its traditional relationship patterns
Deutsche Bank Research report highlights how BTC is increasingly decoupling from its traditional market relationships.
At the start of this year, Bitcoin was one of the few major assets to end the month lower, sliding nearly 11% in January. This move sharply contrasts with Gold (XAU), which rose 13%, and the S&P 500, which gained 1.4%. This downturn marked Bitcoin’s fourth straight monthly decline, a streak not seen since before the Covid-19 pandemic.
The divergence is seen when compared with Gold and Equities. While Gold returned 65%, Bitcoin fell 6.5% in 2025, challenging its “digital gold” narrative as safe-haven demand favored traditional assets amid geopolitical risks and central bank buying.
At the same time, Bitcoin’s 30-day correlation with the Nasdaq and S&P 500 has dropped to around 15%, down sharply from above 50% during the October 2025 sell-off, indicating that BTC is no longer moving in tandem with Equities despite continued market volatility.
Bitcoin Price Forecast: BTC inches away from the $70,000 mark
Bitcoin corrects by over 7% so far this week, slipping below the daily support at $73,072 and reaching a daily low of $70,140 on Thursday.
The current price action for BTC suggests a falling knife scenario. Traders should be cautious, as attempting to buy the dip remains risky amid the potential for further downside.
If BTC closes below its daily support at $73,072, it could extend the decline toward the key psychological level of $70,000. A close below the $70,000 mark could extend losses toward the 78.6% Fibonacci retracement level (from the August 2024 low of $49,000 to the October 2025 all-time high of $126,199) at $65,520.
The Relative Strength Index (RSI) reads 21 on the daily chart, an oversold condition, indicating strong bearish momentum. Additionally, the Moving Average Convergence Divergence (MACD) indicator showed a bearish crossover on January 20, which remains intact with rising red histogram bars below the neutral level, further supporting the negative outlook.
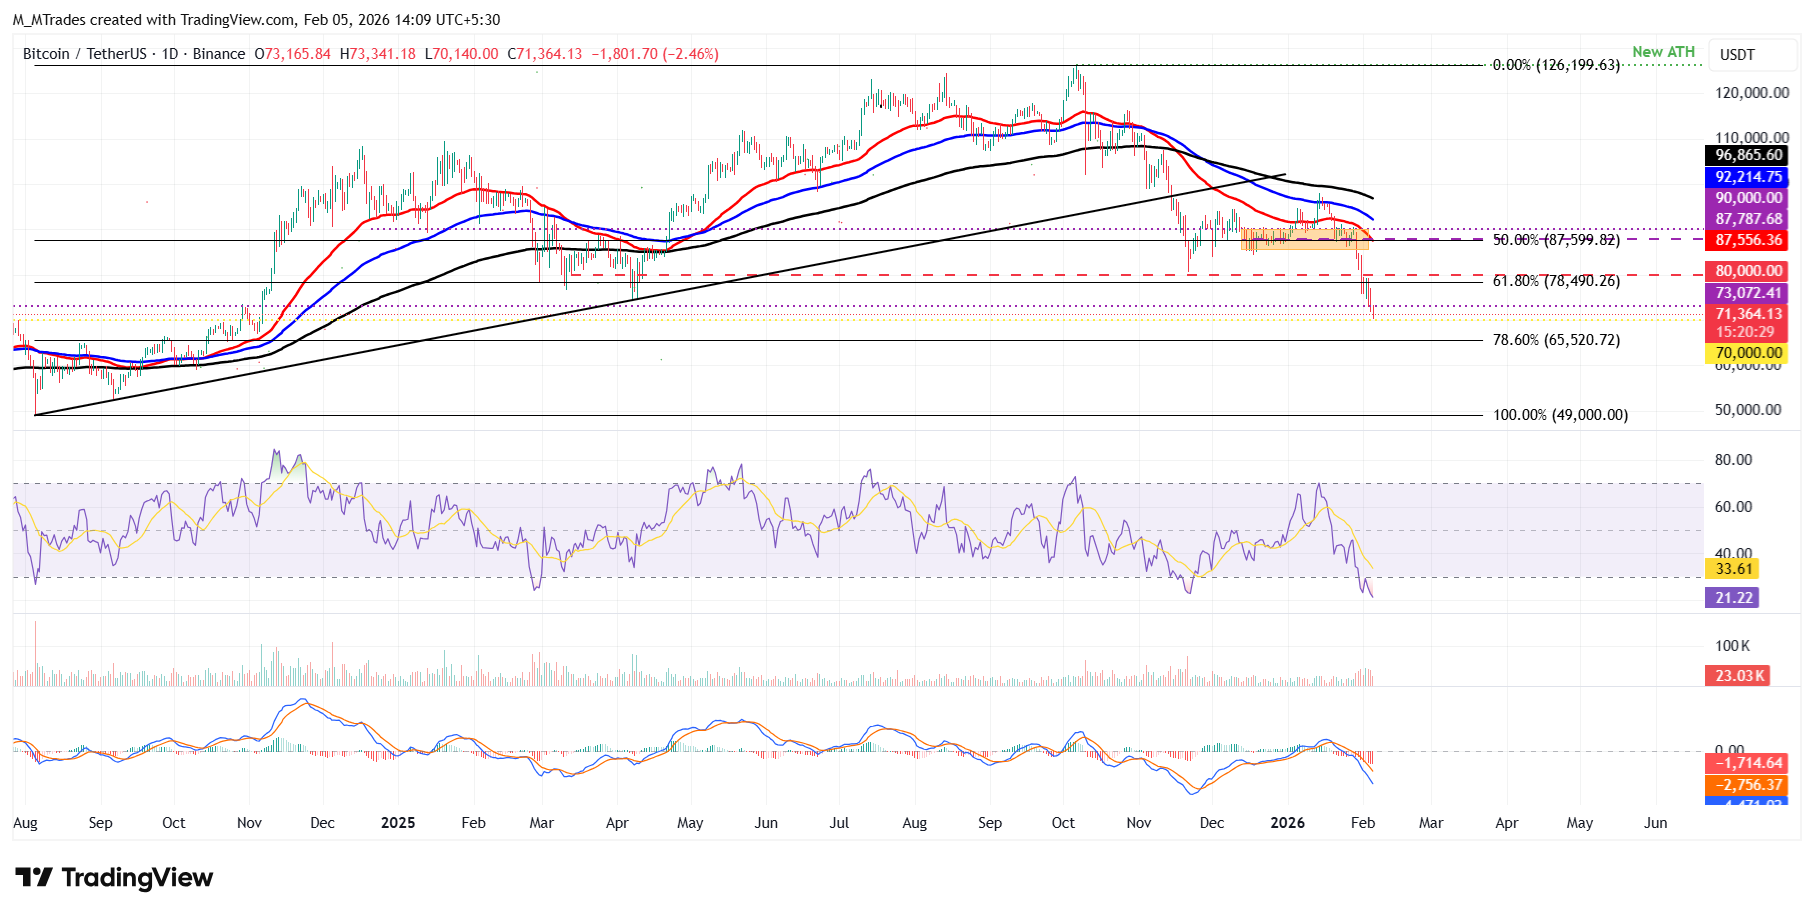
Meanwhile, market participants should keep a watch, as the primary trend for BTC remains bearish, so any short-term recovery is likely to be a dead-cat bounce — a brief price increase within a broader downtrend.
If BTC recovers, it could extend the advance toward the 61.8% Fibonacci retracement level at $78,490.
Bitcoin, altcoins, stablecoins FAQs
Bitcoin is the largest cryptocurrency by market capitalization, a virtual currency designed to serve as money. This form of payment cannot be controlled by any one person, group, or entity, which eliminates the need for third-party participation during financial transactions.
Altcoins are any cryptocurrency apart from Bitcoin, but some also regard Ethereum as a non-altcoin because it is from these two cryptocurrencies that forking happens. If this is true, then Litecoin is the first altcoin, forked from the Bitcoin protocol and, therefore, an “improved” version of it.
Stablecoins are cryptocurrencies designed to have a stable price, with their value backed by a reserve of the asset it represents. To achieve this, the value of any one stablecoin is pegged to a commodity or financial instrument, such as the US Dollar (USD), with its supply regulated by an algorithm or demand. The main goal of stablecoins is to provide an on/off-ramp for investors willing to trade and invest in cryptocurrencies. Stablecoins also allow investors to store value since cryptocurrencies, in general, are subject to volatility.
Bitcoin dominance is the ratio of Bitcoin's market capitalization to the total market capitalization of all cryptocurrencies combined. It provides a clear picture of Bitcoin’s interest among investors. A high BTC dominance typically happens before and during a bull run, in which investors resort to investing in relatively stable and high market capitalization cryptocurrency like Bitcoin. A drop in BTC dominance usually means that investors are moving their capital and/or profits to altcoins in a quest for higher returns, which usually triggers an explosion of altcoin rallies.
추천 기사


