

Crypto Today: Bitcoin, Ethereum, XRP brace for deeper losses as institutions pull back
- Bitcoin edges lower but stays above $91,000 on Tuesday amid continued ETF outflows.
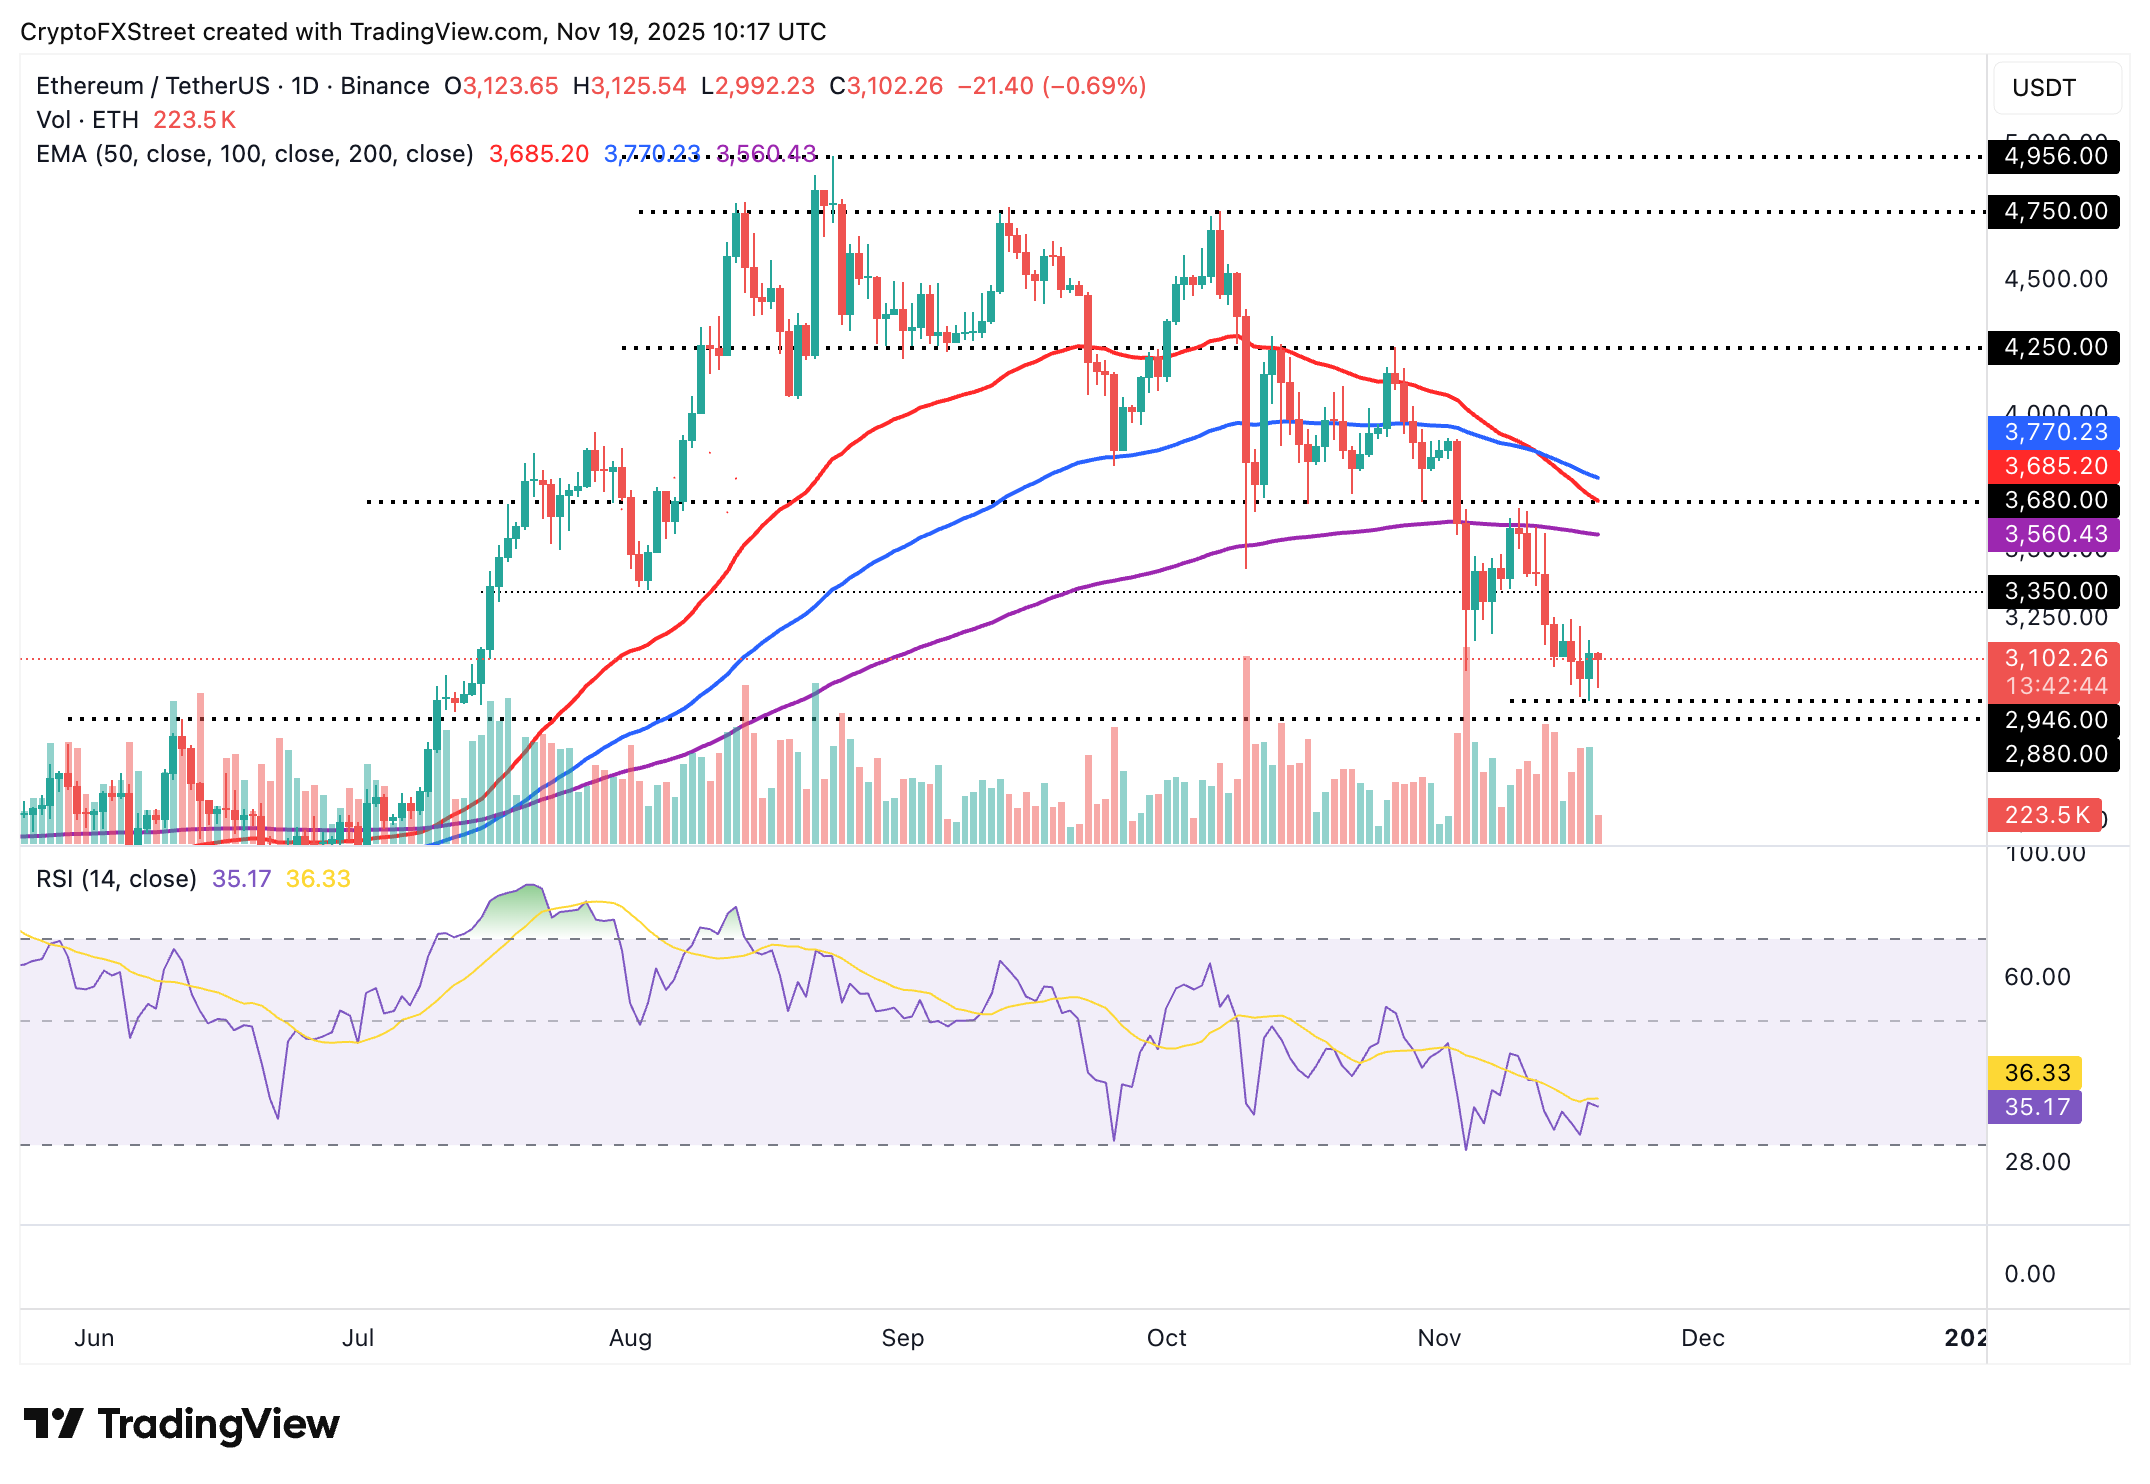
- Ethereum recovery loses steam above $3,100 as volatility shakes off weak hands.
- XRP extends its decline toward $2.00, weighed down by a weak technical structure.
Bitcoin (BTC) is struggling to hold above $91,000 at the time of writing on Wednesday, as headwinds persist in the broader cryptocurrency market. Ethereum (ETH) and Ripple (XRP) are also in the red, following in BTC's footsteps.
Demand for riskier assets, including crypto, has waned since mid-October after Jerome Powell, the Federal Reserve (Fed) Chair, said that a December interest rate cut was not guaranteed.
Since the October 10 flash crash, bearish sentiment has persisted, underpinned by steady outflows from spot Exchange Traded Funds (ETFs) and low retail demand.
Data spotlight: Bitcoin, Ethereum ETF outflows signal weakening demand
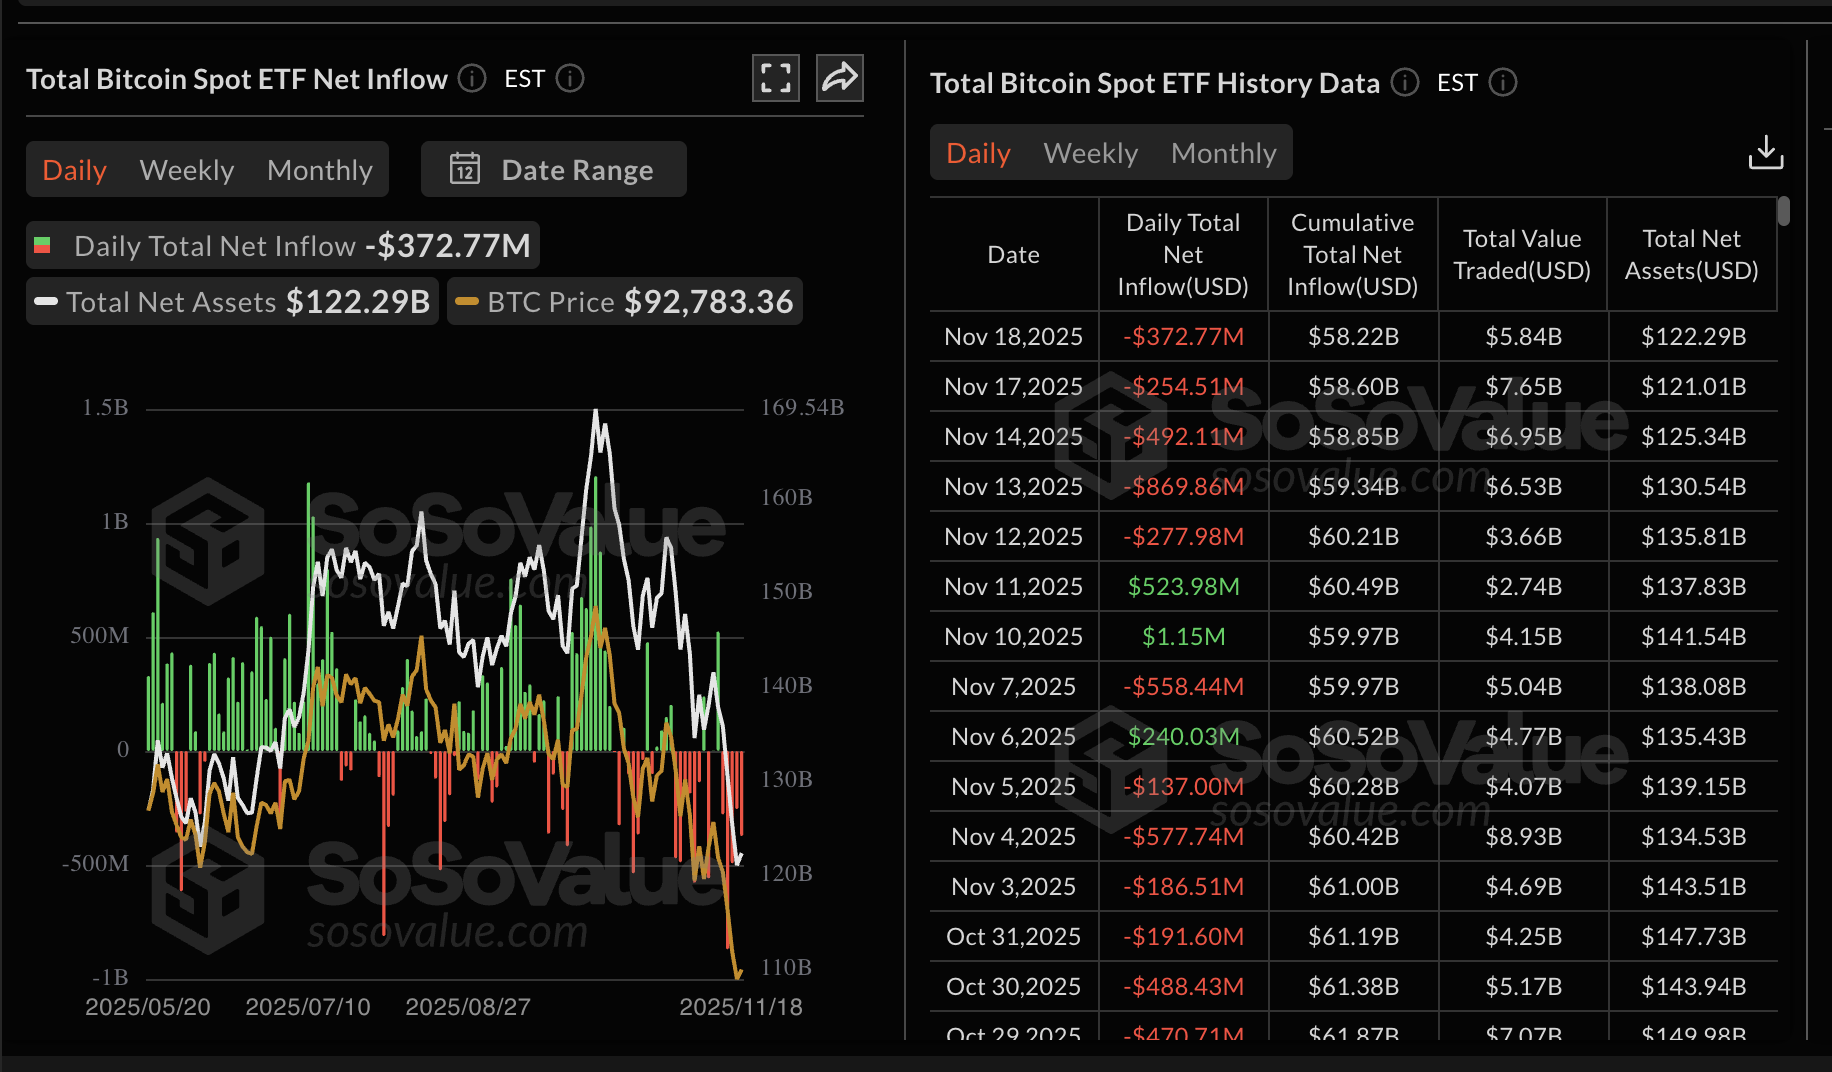
Bitcoin spot ETFs extended their bearish streak with nearly $373 million in outflows on Tuesday. SoSoValue data shows BTC ETFs' net assets have declined to $122.29 billion from approximately $170 billion on October 6. The cumulative net inflow volume averages $58.22 billion.
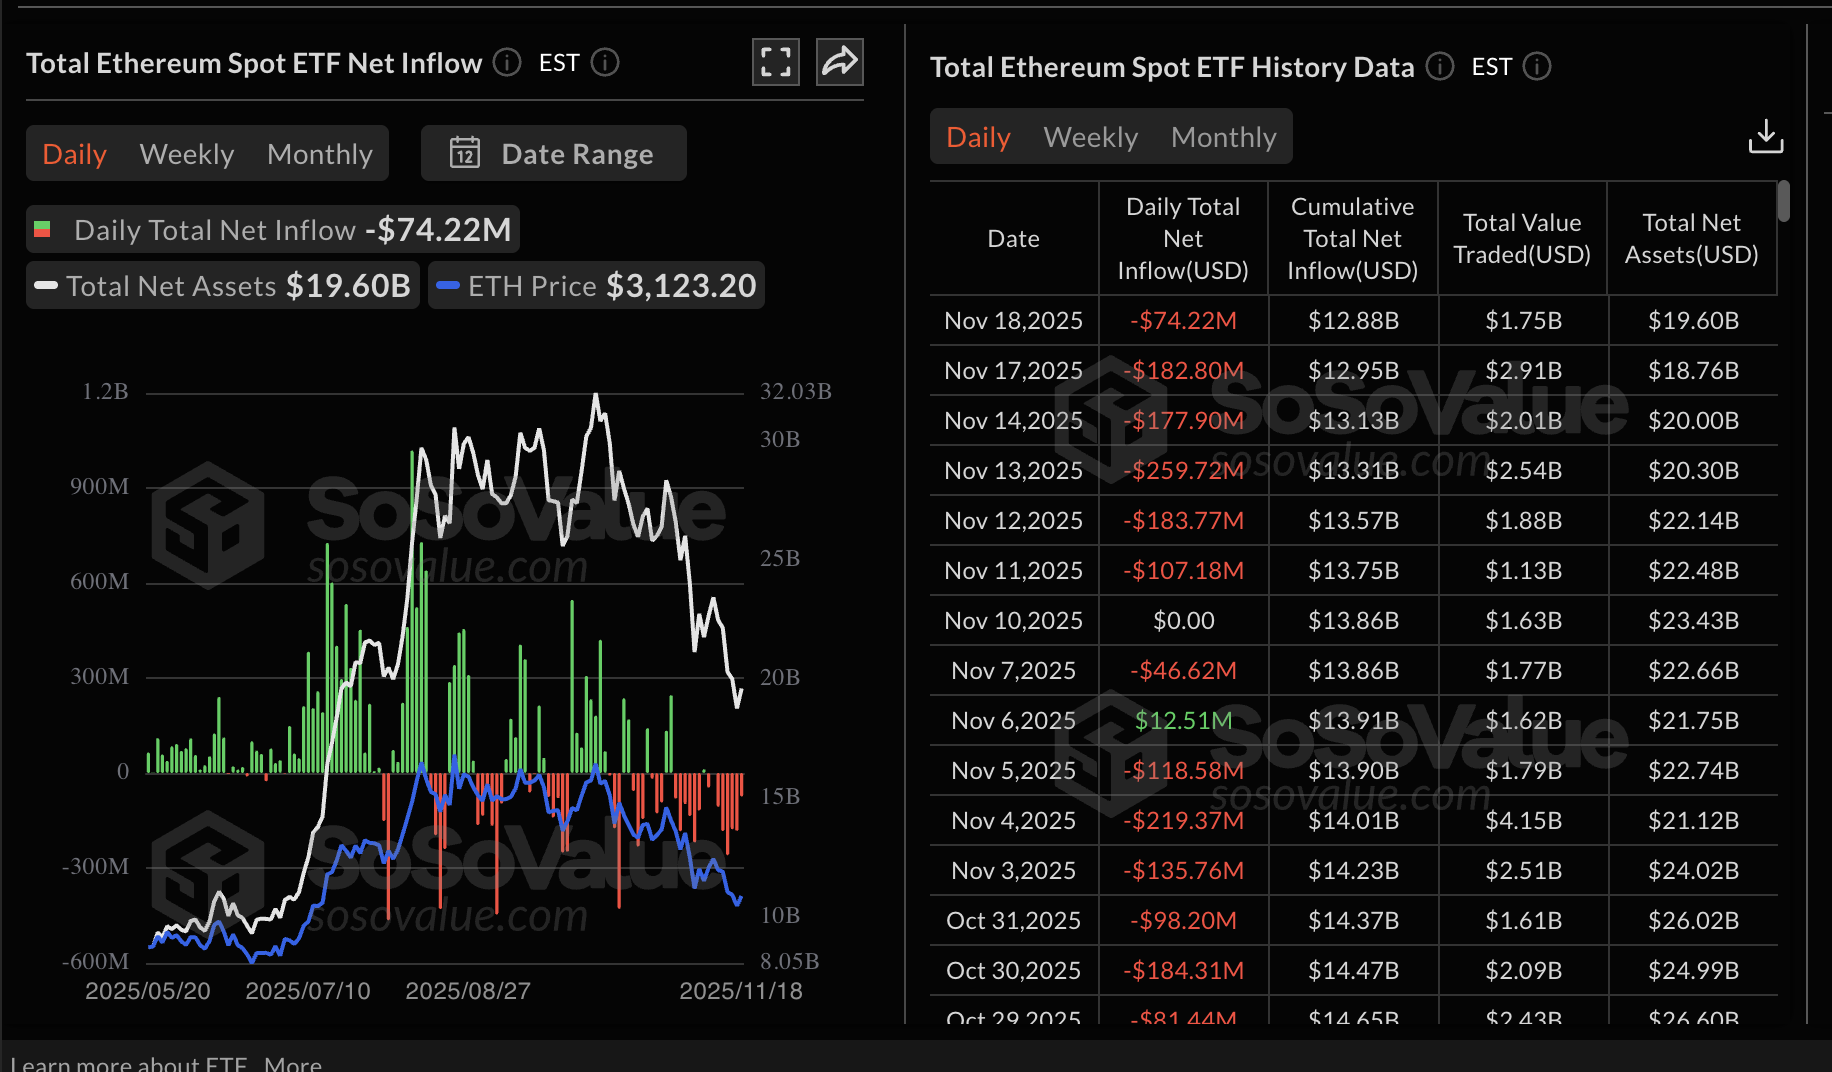
Ethereum ETFs listed in the US are also facing prolonged outflows, with approximately $74 million recorded on Tuesday. SoSoValue data highlights a cumulative inflow volume of $12.88 billion and net assets of $19.6 billion. If ETF outflows continue, sentiment will likely stay weak, making it hard for Ethereum to maintain a recovery in the short to medium term.
Meanwhile, the XRP derivatives market has remained quiet since the October 10 flash crash. The futures Open Interest (OI) averages $3.85 billion on Wednesday, up from $3.6 billion the previous day.
Since OI represents the notional value of outstanding futures contracts, a steady uptrend is required to support XRP recovery in the short term. However, if risk-off sentiment prevails and OI declines in the coming days, the odds of a sell-off below $2.00 will increase.
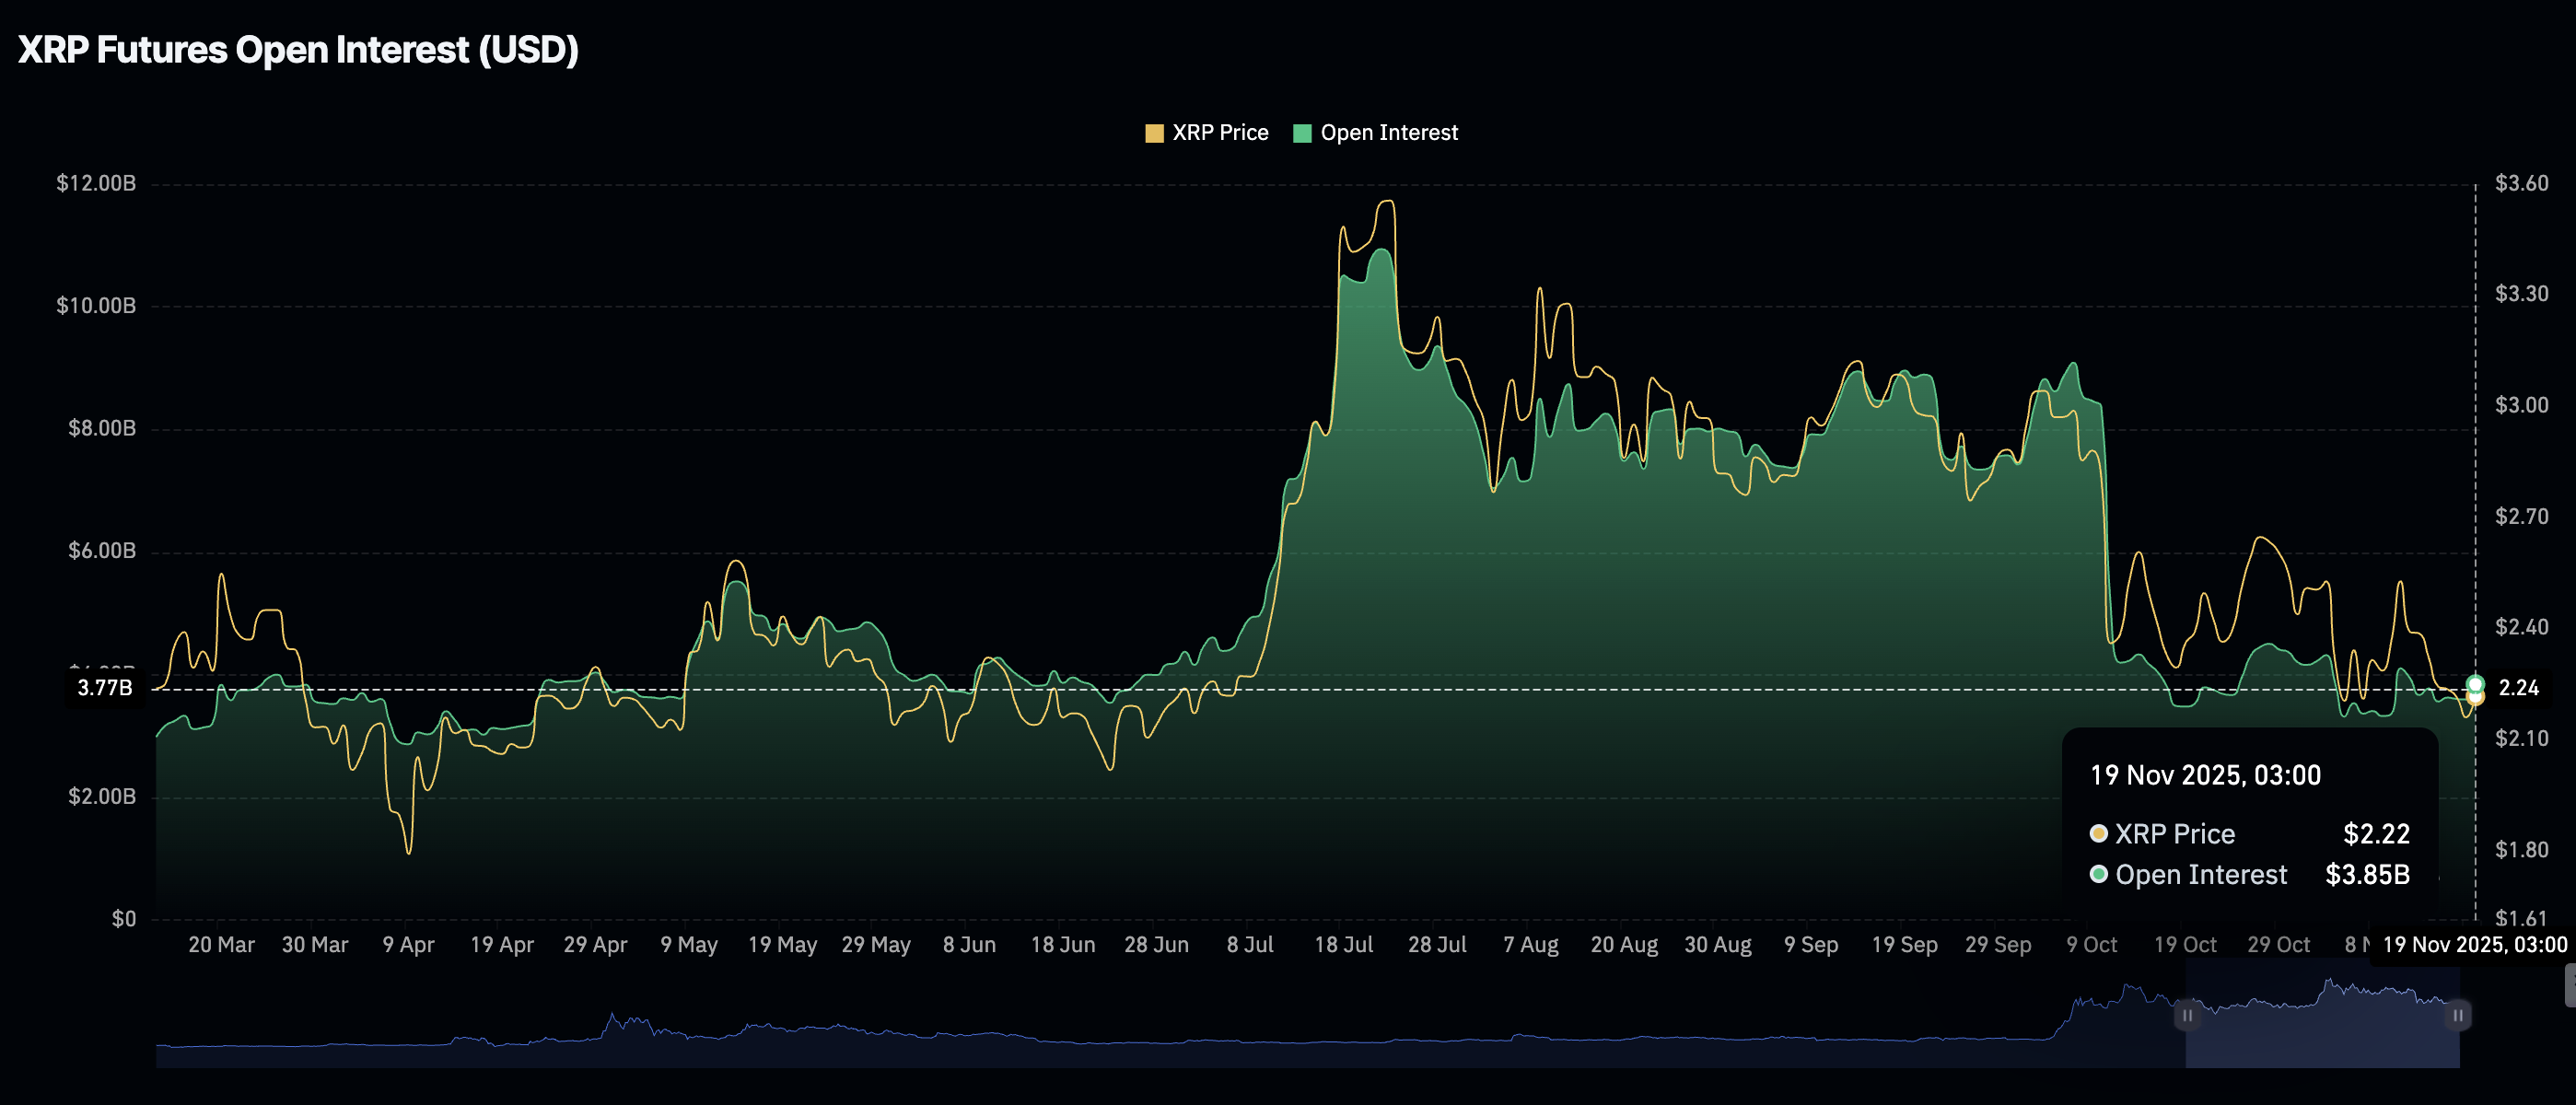
Chart of the day: Bitcoin's downtrend persists amid a weak technical structure
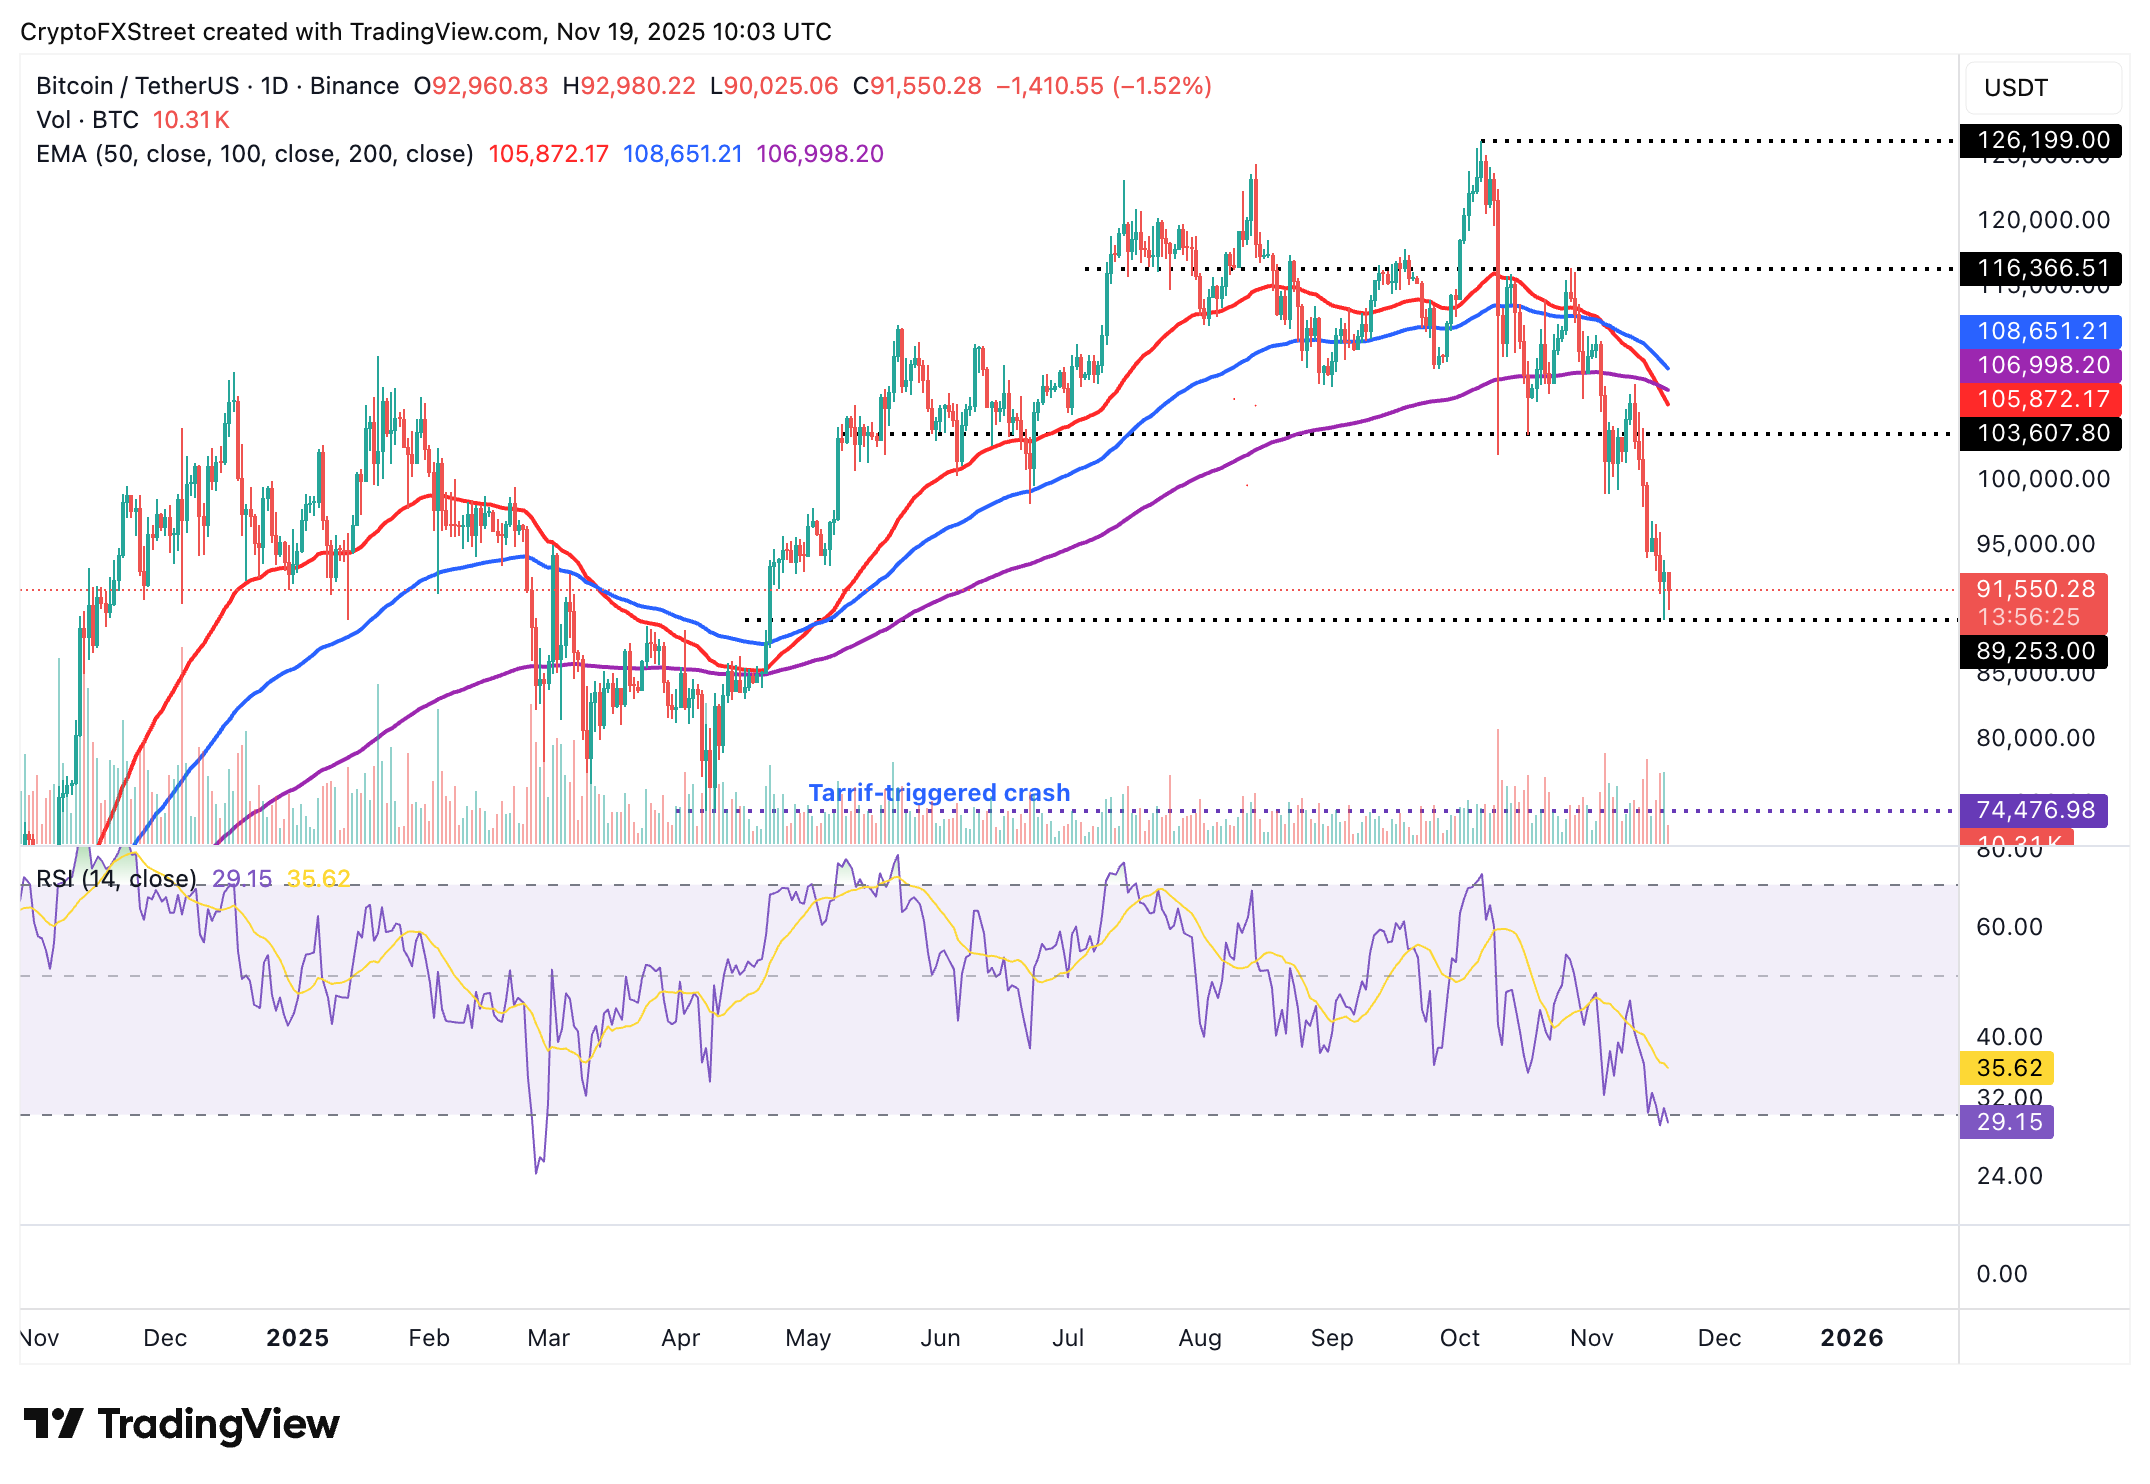
Bitcoin sits above its immediate support at $91,000 at the time of writing on Wednesday, underpinned by increasing bearish signals and weak institutional and retail demand.
A Death Cross pattern, established when the 50-day Exponential Moving Average (EMA) at $105,872 crossed below the 200-day EMA at $106,998, underpins the bearish sentiment.
The Relative Strength Index (RSI) has entered the oversold region on the daily chart, indicating that bearish momentum is increasing. Lower RSI readings would reinforce Bitcoin's short-term bearish outlook, increasing the odds of a steady decline below $90,000.
Altcoins update: Ethereum, XRP extend decline
Ethereum is trading below key moving averages, including the 200-day EMA at $3,560, the 50-day EMA at $3,685 and the 100-day EMA at $3,770, all of which highlight a sticky bearish sentiment and resistance levels.
The RSI on the daily chart is at 35 and is approaching oversold territory, indicating a weakening technical structure. A continued decline would imply strong bearish momentum, likely increasing the chances of an extended decline below $3,000.
As for XRP, the price hovers above support between $2.07 and $2.10 at the time of writing on Wednesday as bulls struggle to gain control. The RSI is at 38 and falling toward oversold territory on the daily chart, which affirms the bearish outlook is showing early signs of stability.
Similarly, the Moving Average Convergence Divergence (MACD) indicator has maintained a sell signal since Sunday, which may continue to call for risk-averse action among investors, potentially contributing to selling pressure.
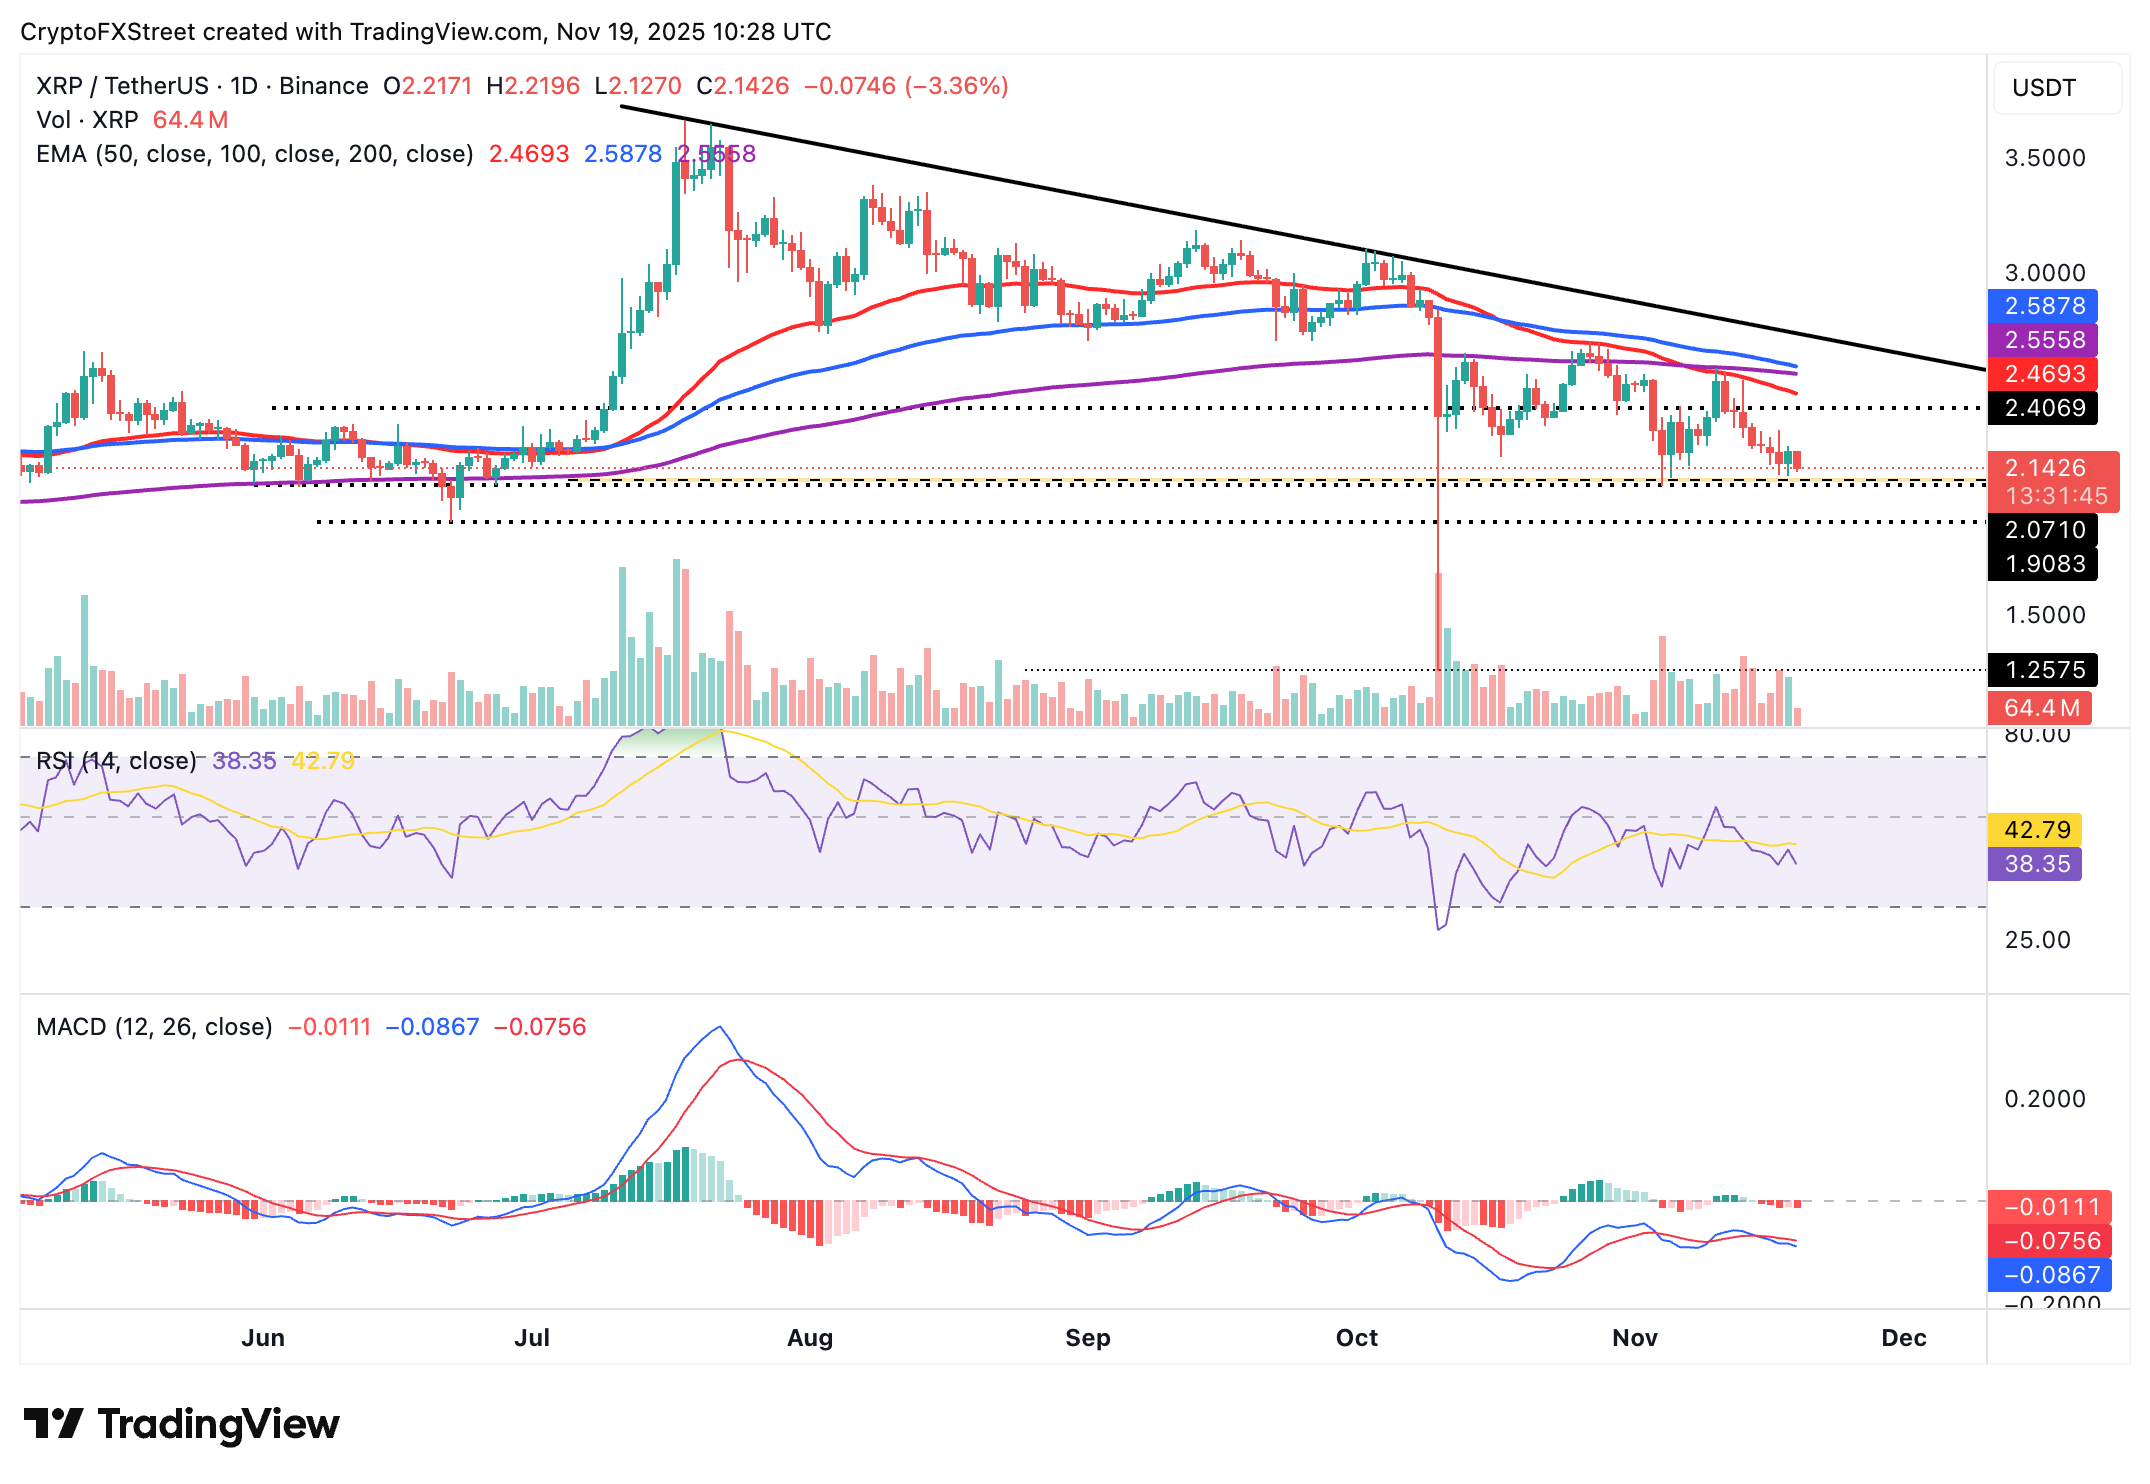
If XRP pushes below its immediate support zone at $2.07–$2.10, it could trigger a drop beneath $2.00. The next key level to watch is $1.90, which was last tested in June.
Crypto ETF FAQs
An Exchange-Traded Fund (ETF) is an investment vehicle or an index that tracks the price of an underlying asset. ETFs can not only track a single asset, but a group of assets and sectors. For example, a Bitcoin ETF tracks Bitcoin’s price. ETF is a tool used by investors to gain exposure to a certain asset.
Yes. The first Bitcoin futures ETF in the US was approved by the US Securities & Exchange Commission in October 2021. A total of seven Bitcoin futures ETFs have been approved, with more than 20 still waiting for the regulator’s permission. The SEC says that the cryptocurrency industry is new and subject to manipulation, which is why it has been delaying crypto-related futures ETFs for the last few years.
Yes. The SEC approved in January 2024 the listing and trading of several Bitcoin spot Exchange-Traded Funds, opening the door to institutional capital and mainstream investors to trade the main crypto currency. The decision was hailed by the industry as a game changer.
The main advantage of crypto ETFs is the possibility of gaining exposure to a cryptocurrency without ownership, reducing the risk and cost of holding the asset. Other pros are a lower learning curve and higher security for investors since ETFs take charge of securing the underlying asset holdings. As for the main drawbacks, the main one is that as an investor you can’t have direct ownership of the asset, or, as they say in crypto, “not your keys, not your coins.” Other disadvantages are higher costs associated with holding crypto since ETFs charge fees for active management. Finally, even though investing in ETFs reduces the risk of holding an asset, price swings in the underlying cryptocurrency are likely to be reflected in the investment vehicle too.
추천 기사


