

Pi Network Price Forecast: PI recovers amid new Pi App Studio updates
- Pi Network extends the recovery for the third consecutive day, after a 3.52% surge on Sunday.
- The announcement of fresh updates for Pi App Studio aligns with the token’s short-term recovery.
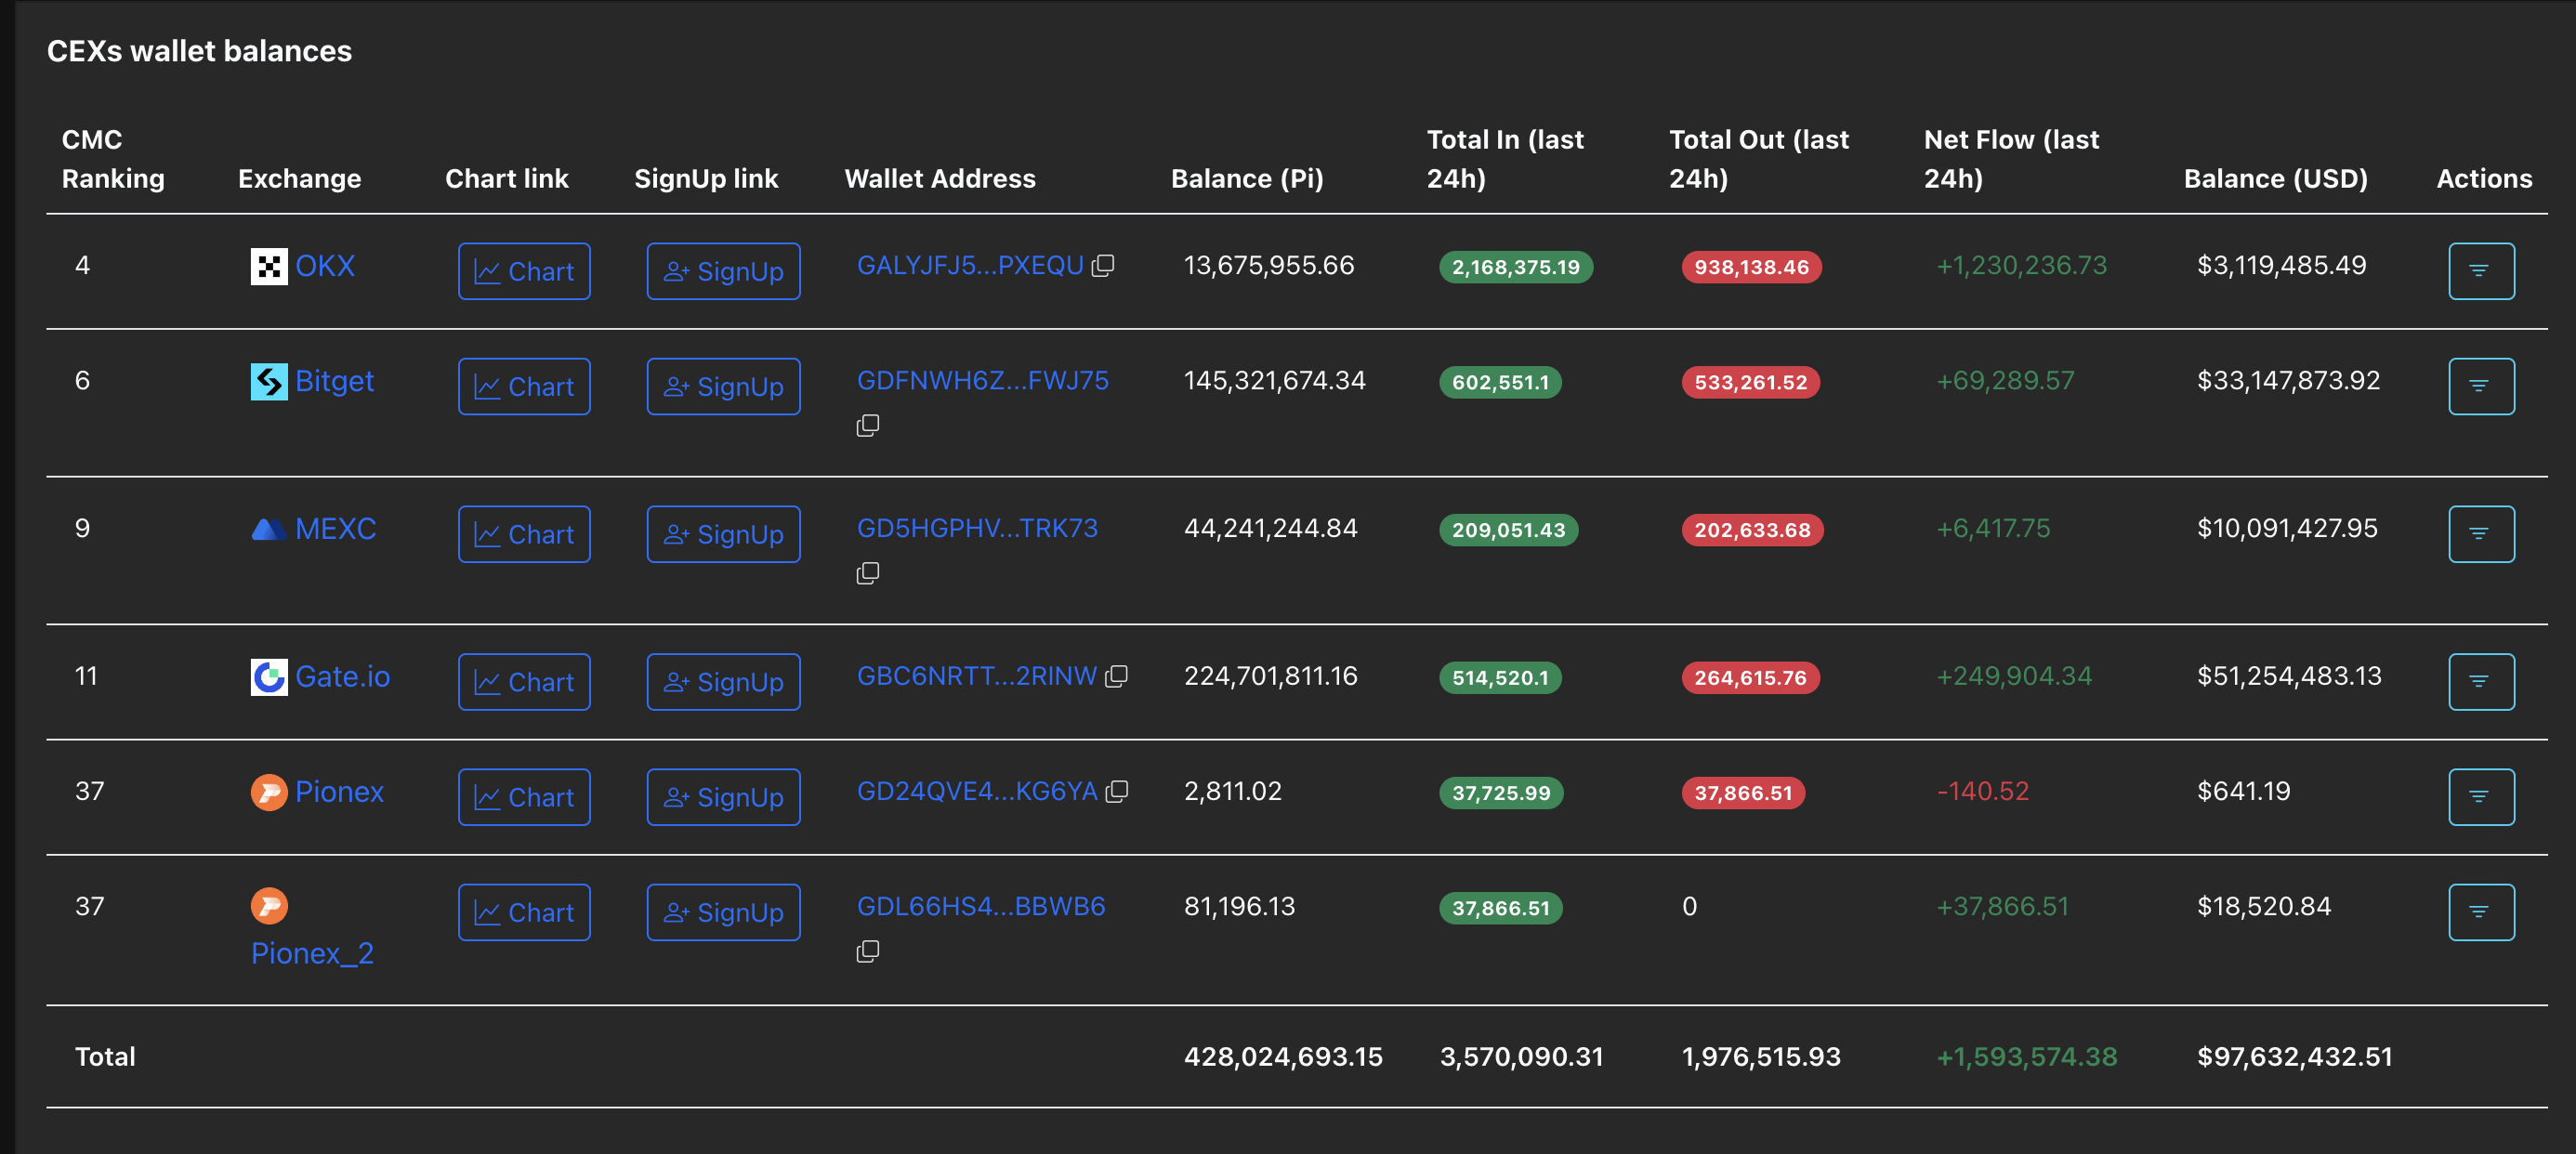
- Centralized Exchanges record a net inflow of 1.59 million PI tokens, indicating that holders are realizing profits.
Pi Network (PI) trades above $0.2200 at press time on Monday, sustaining the 3.52% gains from Sunday. The announcement of Pi App Studio updates on Thursday aligns with the three-day recovery in PI token, with bulls aiming towards the 50-day Exponential Moving Average.
However, the rising inflows on Centralized Exchange (CEX) wallets indicate large user deposits, a sign of profit-taking, which could add to overhead supply pressure.
Holders realize profit as Pi Network rolls out new updates
Pi Network released fresh updates in the Pi App Studio on Thursday, providing developers with more customization and flexibility, as well as a new management and creator interface. The push for development on the Pi Network reflects the management’s enthusiasm to expand from mobile mining cryptocurrency to a larger Web 3.0 ecosystem.

Despite the expansion plans, the short-term on-chain flow indicates low confidence among PI token holders. According to PiScan, the CEXs' wallet balances recorded a net deposit of 1.59 million PI in the last 24 hours, primarily on OKX, with a net deposit of 1.23 million. The increase in user deposits on CEXs suggests that investors with verified Know Your Customer (KYC) status are taking profits, which could contribute to an increased supply of overhead.
Pi Network signals a potential bullish shift to the ongoing consolidation
Pi Network’s recent three-day recovery is part of the lateral extension between the October 11 low of $0.1919 and the declining 50-day EMA at $0.2435. The positive shift in the consolidation range aims to challenge the overhead moving average, which has acted as a dynamic resistance, intact since late May.
If PI holds a successful close above $0.2435, it could confirm the bullish trend reversal. In such a case, the $0.2613 and $0.3220 levels marked by the lows of September 23 and August 1, respectively, could serve as overhead resistances.
The momentum indicators on the daily chart maintain a neutral stance, as the Moving Average Convergence Divergence (MACD) exhibits a sideways trend with its signal line. Meanwhile, the Relative Strength Index (RSI) at 49 indicates a decline in selling pressure, promoting upside potential.
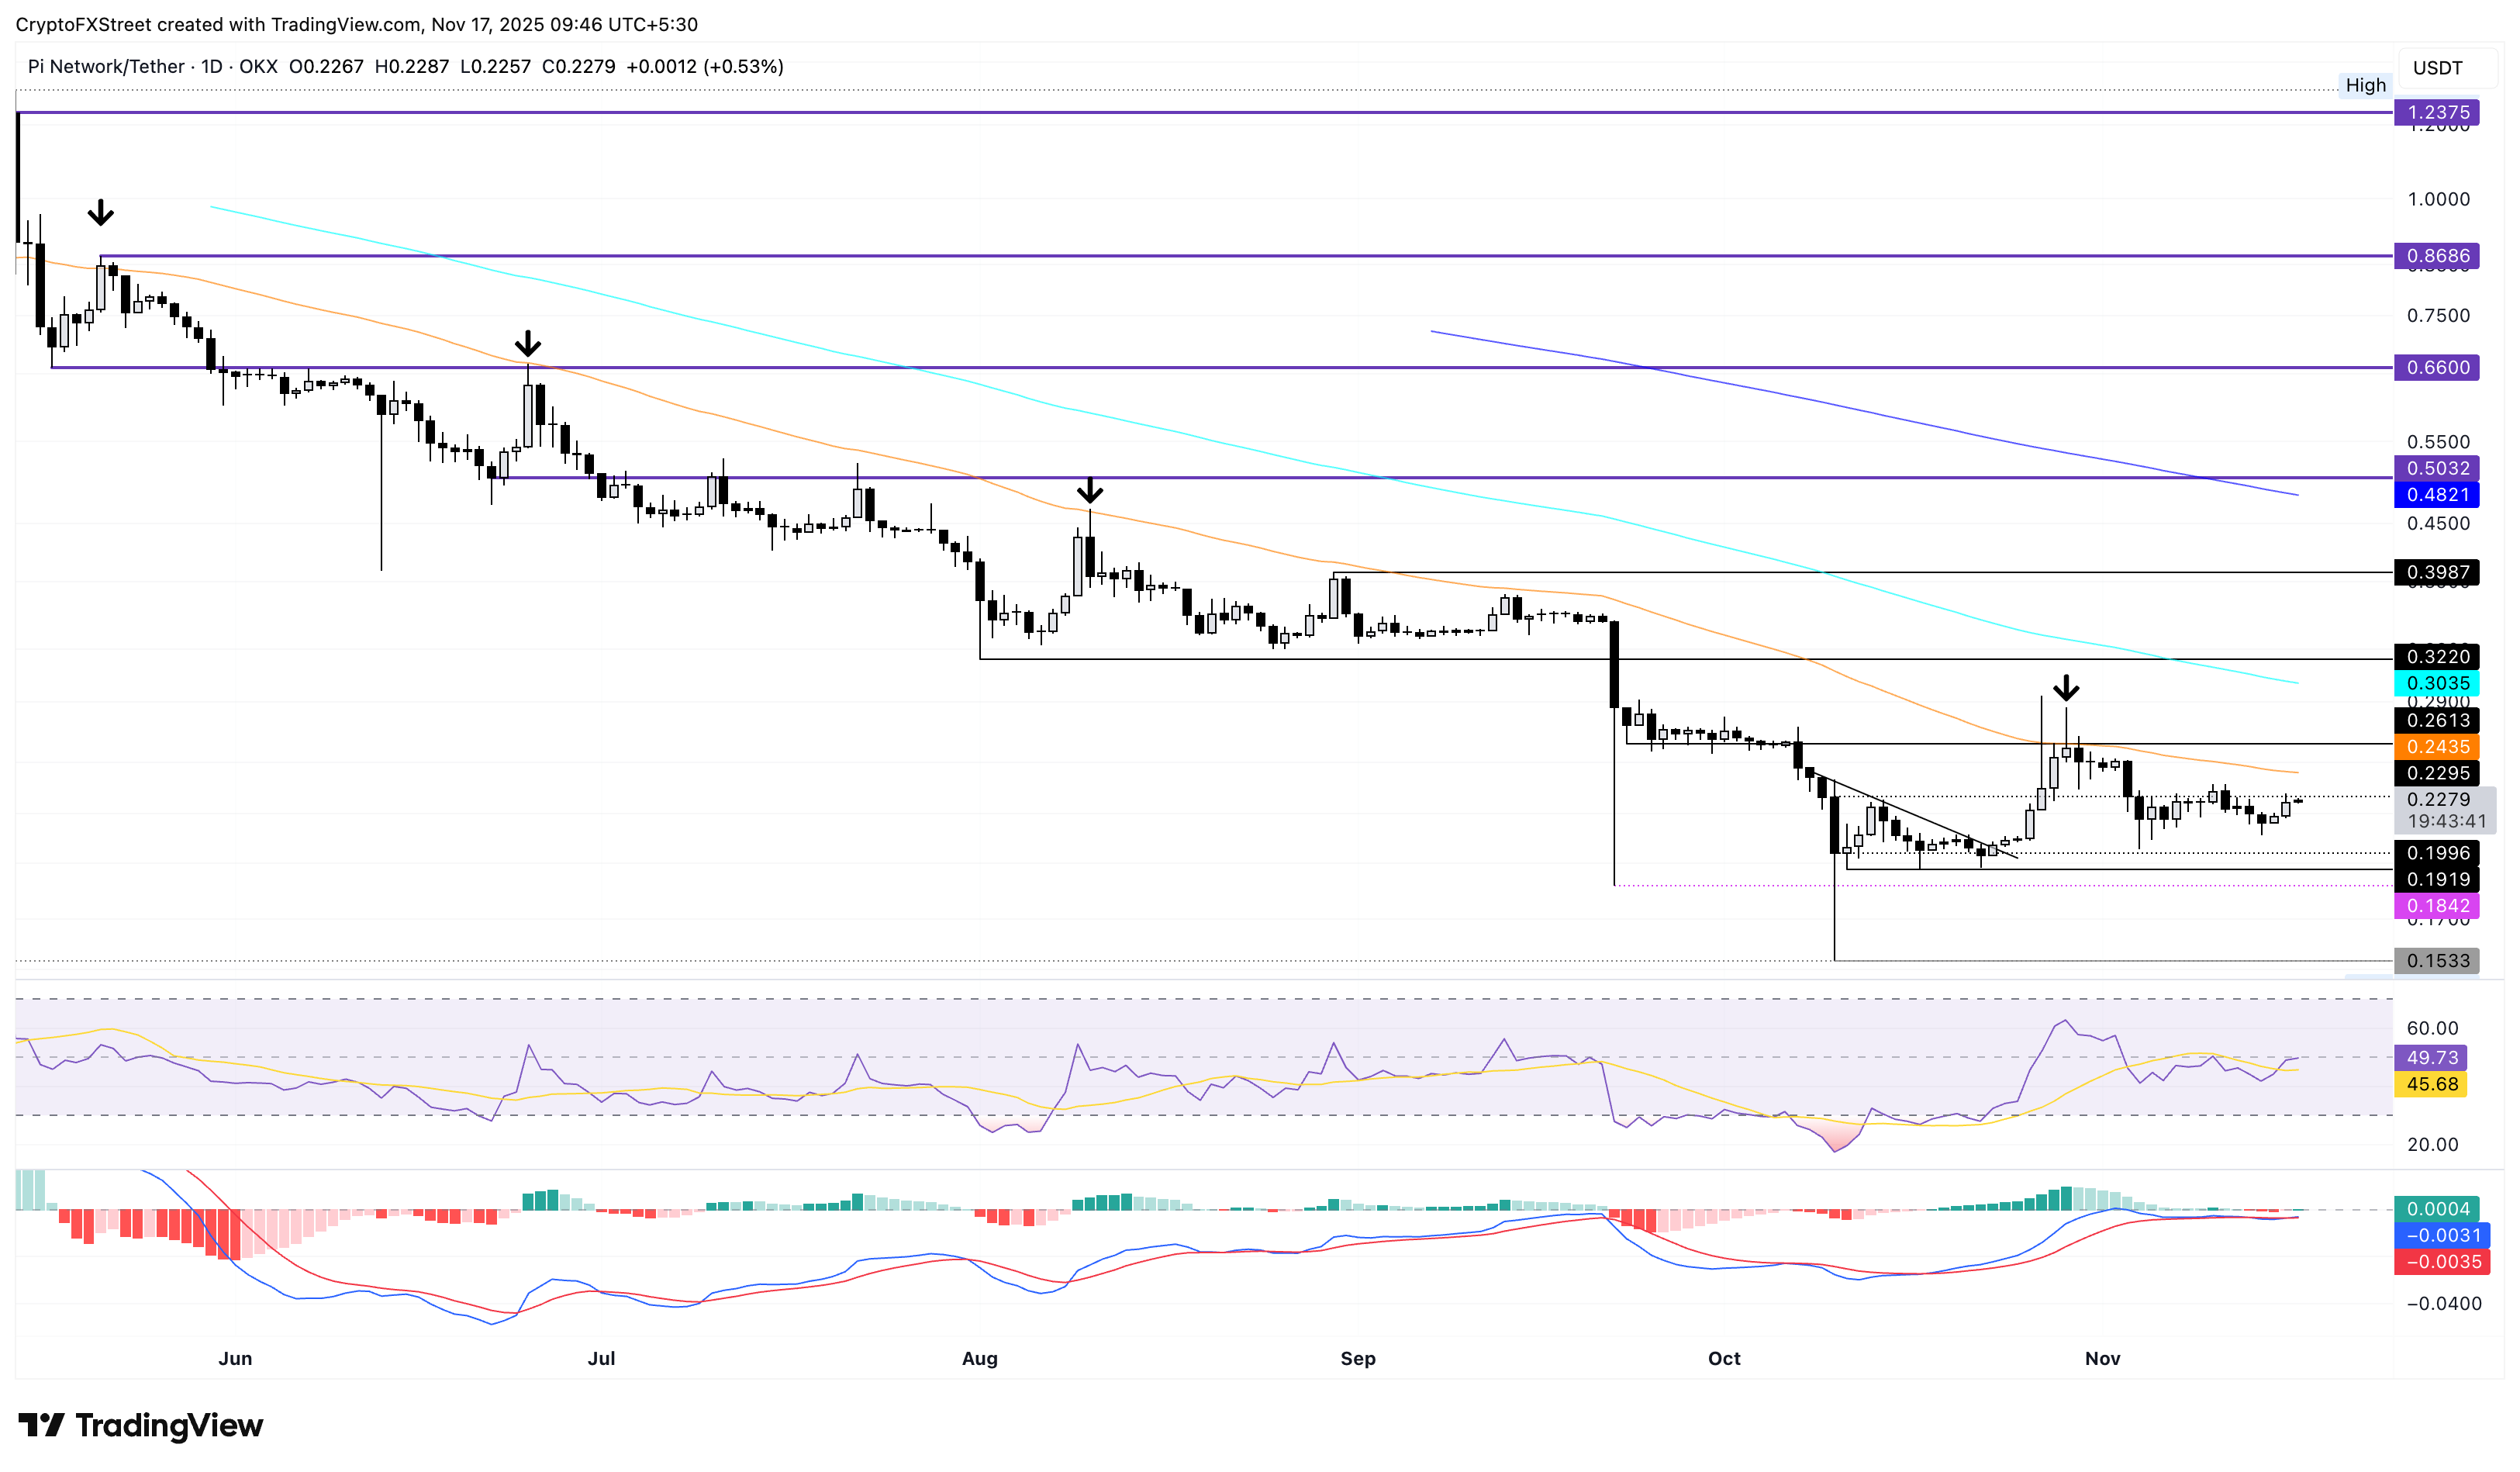
On the downside, the key support levels for PI remain at the $0.1919 and $0.1533 lows from October 11 and 10, respectively.
Bitcoin, altcoins, stablecoins FAQs
Bitcoin is the largest cryptocurrency by market capitalization, a virtual currency designed to serve as money. This form of payment cannot be controlled by any one person, group, or entity, which eliminates the need for third-party participation during financial transactions.
Altcoins are any cryptocurrency apart from Bitcoin, but some also regard Ethereum as a non-altcoin because it is from these two cryptocurrencies that forking happens. If this is true, then Litecoin is the first altcoin, forked from the Bitcoin protocol and, therefore, an “improved” version of it.
Stablecoins are cryptocurrencies designed to have a stable price, with their value backed by a reserve of the asset it represents. To achieve this, the value of any one stablecoin is pegged to a commodity or financial instrument, such as the US Dollar (USD), with its supply regulated by an algorithm or demand. The main goal of stablecoins is to provide an on/off-ramp for investors willing to trade and invest in cryptocurrencies. Stablecoins also allow investors to store value since cryptocurrencies, in general, are subject to volatility.
Bitcoin dominance is the ratio of Bitcoin's market capitalization to the total market capitalization of all cryptocurrencies combined. It provides a clear picture of Bitcoin’s interest among investors. A high BTC dominance typically happens before and during a bull run, in which investors resort to investing in relatively stable and high market capitalization cryptocurrency like Bitcoin. A drop in BTC dominance usually means that investors are moving their capital and/or profits to altcoins in a quest for higher returns, which usually triggers an explosion of altcoin rallies.
추천 기사


