

Silver Price Forecast: XAG/USD finds cushion after plummeting to $31.30, Fed Powell’s speech eyed
- Silver price discovers temporary support near $31.30 as the US Dollar drops ahead of Fed Powell’s testimony before Congress.
- Fed Powell guided that interest rates will remain at their current levels in the January policy meeting.
- Deepening fears of a global trade war would keep the Silver price in the frontfoot.
Silver price (XAG/USD) finds a temporary cushion near $31.30 in Tuesday’s North American session after declining sharply earlier in the day. The white metal gauges little buying interest as the US Dollar (USD) drops ahead of Federal Reserve (Fed) Chair Jerome Powell’s testimony before Congress.
The US Dollar Index (DXY), which tracks the Greenback’s value against six major currencies, faces slight pressure and drops to near 108.20.
Market participants will pay close attention to the Fed Powell’s commentary on the interest rate outlook. In January, Powell said in the press conference after interest rates remained steady that monetary policy adjustments won’t be appropriate unless officials see “real progress in inflation or at least some weakness in the labor market”.
By that time, the major catalyst for the Fed to assess the monetary policy stance had been the United States (US) Nonfarm Payrolls (NFP) data for January, which showed that the Unemployment Rate decelerated to 4% and employment numbers missed estimates due to extreme weather events.
However, the overall outlook of the Silver price remains firm due to heightened fears of a global trade war. On Monday, US President Donald Trump signed executive orders to impose 25% tariffs on imports of steel and aluminum, without exemptions and exceptions, and guided that there will be reciprocal tariffs in the coming days. Historically, the appeal of precious metals, such as Silver, increases in an uncertain global environment.
Silver technical analysis
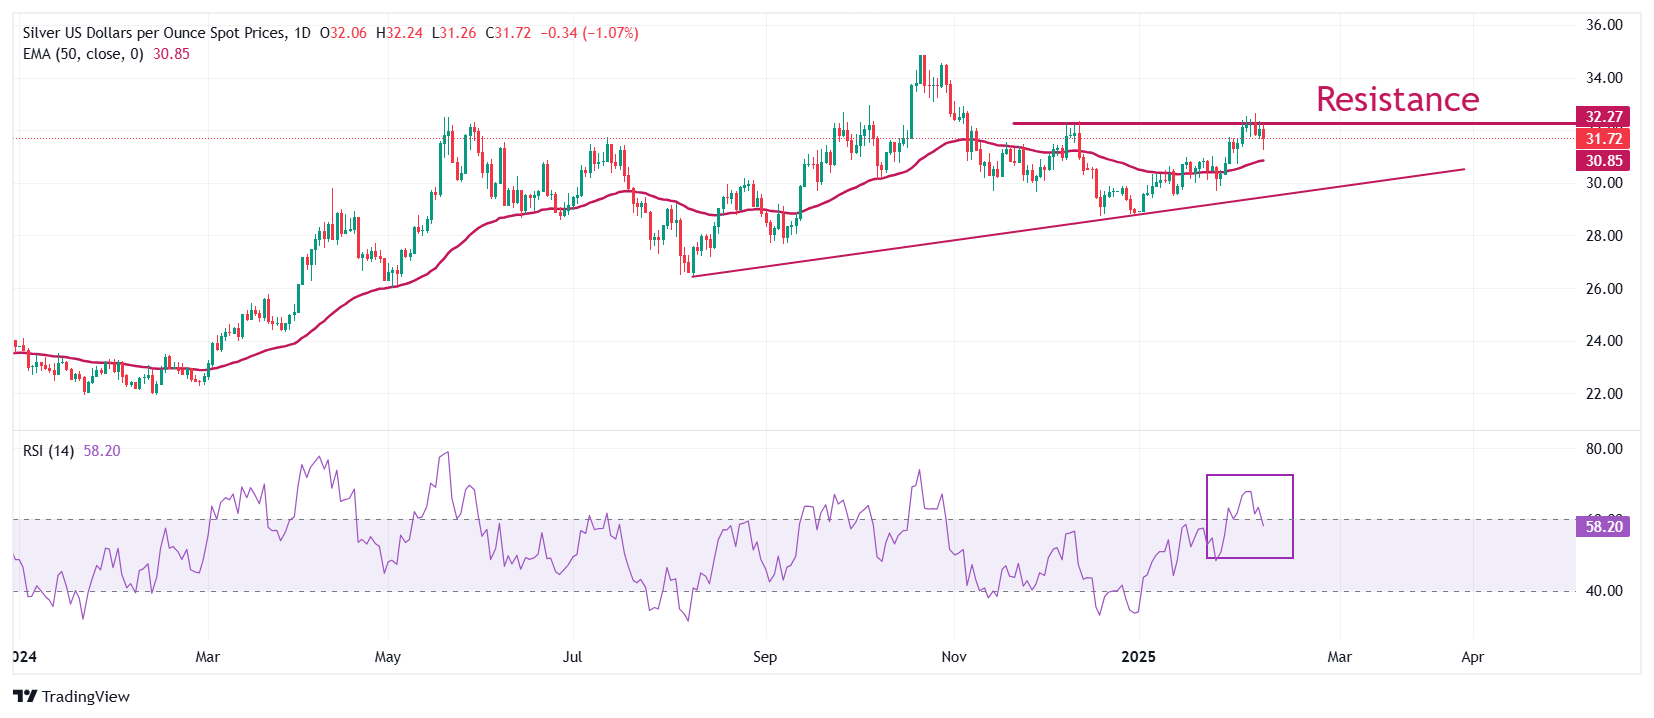
Silver price continues to face pressure near the immediate resistance of $32.50, which is plotted from the December 9 high. The outlook of the white metal remains bullish as it holds above the 50-day Exponential Moving Average (EMA), which trades around $30.85.
The 14-day Relative Strength Index (RSI) falls back inside the 40.00-60.00 range, suggesting that the momentum is not bullish for now. However, the upside bias is intact.
Looking down, the upward-sloping trendline from the August 8 low of $26.45 will be the key support for the Silver price around $29.50. While, the October 31 high of $33.90 will be the key barrier.
Silver daily chart
Silver FAQs
Silver is a precious metal highly traded among investors. It has been historically used as a store of value and a medium of exchange. Although less popular than Gold, traders may turn to Silver to diversify their investment portfolio, for its intrinsic value or as a potential hedge during high-inflation periods. Investors can buy physical Silver, in coins or in bars, or trade it through vehicles such as Exchange Traded Funds, which track its price on international markets.
Silver prices can move due to a wide range of factors. Geopolitical instability or fears of a deep recession can make Silver price escalate due to its safe-haven status, although to a lesser extent than Gold's. As a yieldless asset, Silver tends to rise with lower interest rates. Its moves also depend on how the US Dollar (USD) behaves as the asset is priced in dollars (XAG/USD). A strong Dollar tends to keep the price of Silver at bay, whereas a weaker Dollar is likely to propel prices up. Other factors such as investment demand, mining supply – Silver is much more abundant than Gold – and recycling rates can also affect prices.
Silver is widely used in industry, particularly in sectors such as electronics or solar energy, as it has one of the highest electric conductivity of all metals – more than Copper and Gold. A surge in demand can increase prices, while a decline tends to lower them. Dynamics in the US, Chinese and Indian economies can also contribute to price swings: for the US and particularly China, their big industrial sectors use Silver in various processes; in India, consumers’ demand for the precious metal for jewellery also plays a key role in setting prices.
Silver prices tend to follow Gold's moves. When Gold prices rise, Silver typically follows suit, as their status as safe-haven assets is similar. The Gold/Silver ratio, which shows the number of ounces of Silver needed to equal the value of one ounce of Gold, may help to determine the relative valuation between both metals. Some investors may consider a high ratio as an indicator that Silver is undervalued, or Gold is overvalued. On the contrary, a low ratio might suggest that Gold is undervalued relative to Silver.
추천 기사


