


Gold bulls hit 100-day SMA wall as US yields bite
- Gold stalls below the 100-day SMA as Treasury yields bite.
- Fed hike odds near certainty, keeping non-yielding bullion pressured.
- A break below $4,275 could reopen broader downside momentum.
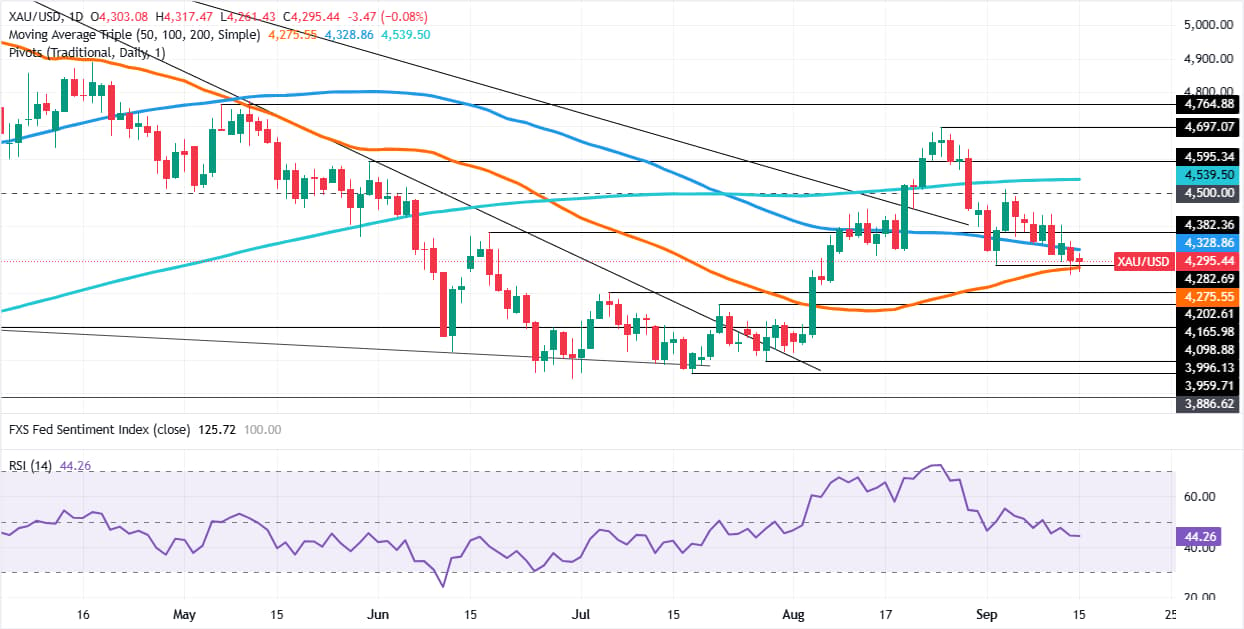
Gold (XAU/USD) price holds firm on Tuesday, capped on the upside by solid resistance at the 100-day Simple Moving Average (SMA) at $4,328, while broad US Dollar strength and elevated US bond yields weighed on the non-yielding metal. At the time of writing, the XAU/USD pair trades at $4,295, down 0.06%.
XAU/USD stalls beneath key resistance as Fed hike becomes near certainty
The Houthis' attack on the Saudi Arabia East-West Oil pipeline pushed energy prices higher and would shut production of around 7 million barrels a day for at least three to five weeks. Investors fearful of another round of inflation pushed the US 10-year Treasury yield past the 5% threshold to levels not seen in almost 19 years, before stabilizing at exactly 5.00%.
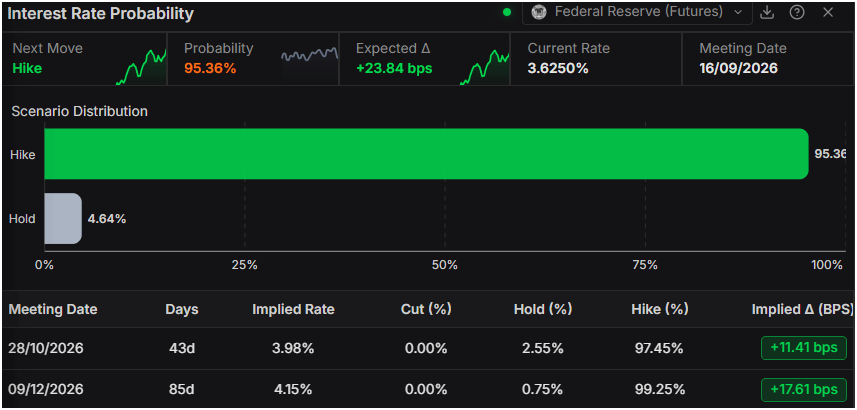
Last week’s inflation figures and geopolitical developments pushed markets to almost fully price in a 25-basis-point rate hike by the Federal Reserve (Fed) to 3.75%-4%, with odds standing at 95%, making bullion less appealing due to its non-yielding properties.
For the October meeting, the odds of a rate hike are 97%, and for December, 99%, according to Prime Terminal.
Given the potential start of a tightening cycle in the US, Gold could resume its downtrend despite a short-term bottom near the 50-day SMA at $4,275.
The US Dollar Index (DXY), which measures the performance of the Greenback against a basket of six currencies, is at 99.66, up 0.19%.
Earlier, the ADP Employment Change 4-week average rose by 16.25K above last week’s print, revised upward to 12.25K.
The central bank bonanza begins with the Federal Reserve monetary policy decision on Wednesday. Next, the Bank of England is expected to keep the Bank Rate at 3.7%, with a 6-3 vote split likely for the third time. On Friday, the Bank of Japan is likely to raise rates by 25 basis points to 1.25%.
This is another reason why bullion prices are under downward pressure. Although it is a strong asset for inflation hedging, increasing global bond yields weaken its attractiveness.
XAU/USD Price Forecast: Gold poised to consolidate further, around $4,300
Price action shows Gold is trapped between the 100- and 50-day SMAs, with the former acting as the first key resistance and the latter the first line of defense for bulls. The Relative Strength Index (RSI), although bearish, does not provide a clear clue of who is winning the battle in the short term. This suggests that further sideways trading lies ahead.
For a bullish breakout, Gold must clear the 100-day SMA at $4,328. Once it has cleared the psychological $4,350, $4,400 is up next, before traders could aim to the $4,500 milestone. If those levels are removed, the 200-day SMA becomes the next supply area at $4,539, ahead of $4,600.
On the flip side, if XAU drops below the 50-day SMA at $4,275, it opens the way to challenge the July 6 high at $4,202, followed by the July 29 swing low of $3,996 under the $4,000 psychological mark.
Gold FAQs
Gold has played a key role in human’s history as it has been widely used as a store of value and medium of exchange. Currently, apart from its shine and usage for jewelry, the precious metal is widely seen as a safe-haven asset, meaning that it is considered a good investment during turbulent times. Gold is also widely seen as a hedge against inflation and against depreciating currencies as it doesn’t rely on any specific issuer or government.
Central banks are the biggest Gold holders. In their aim to support their currencies in turbulent times, central banks tend to diversify their reserves and buy Gold to improve the perceived strength of the economy and the currency. High Gold reserves can be a source of trust for a country’s solvency. Central banks added 1,136 tonnes of Gold worth around $70 billion to their reserves in 2022, according to data from the World Gold Council. This is the highest yearly purchase since records began. Central banks from emerging economies such as China, India and Turkey are quickly increasing their Gold reserves.
Gold has an inverse correlation with the US Dollar and US Treasuries, which are both major reserve and safe-haven assets. When the Dollar depreciates, Gold tends to rise, enabling investors and central banks to diversify their assets in turbulent times. Gold is also inversely correlated with risk assets. A rally in the stock market tends to weaken Gold price, while sell-offs in riskier markets tend to favor the precious metal.
The price can move due to a wide range of factors. Geopolitical instability or fears of a deep recession can quickly make Gold price escalate due to its safe-haven status. As a yield-less asset, Gold tends to rise with lower interest rates, while higher cost of money usually weighs down on the yellow metal. Still, most moves depend on how the US Dollar (USD) behaves as the asset is priced in dollars (XAU/USD). A strong Dollar tends to keep the price of Gold controlled, whereas a weaker Dollar is likely to push Gold prices up.
추천 기사


