

Gold holds near $4,700 but heads for weekly loss on higher-for-longer rate outlook
- Gold steadies near $4,700 but remains on track for a weekly loss as prospects of higher-for-longer interest rates weigh.
- Stronger US Dollar and firm Treasury yields keep pressure on the non-yielding metal.
- XAU/USD trades below a moving average cluster on the 4-hour chart, keeping downside pressure intact.
Gold (XAU/USD) steadies on Friday, erasing earlier losses but remains on track to close the week in negative territory, as macro headwinds linked to ongoing Middle East tensions keep buyers on the sidelines.
At the time of writing, XAU/USD is trading around $4,709 after hitting an intraday low of $4,657, down nearly 2.5% so far this week.
The decline comes as stalled US-Iran peace talks and escalating tensions in the Strait of Hormuz push Oil prices higher, fueling inflation fears and reinforcing expectations that central banks, particularly the Federal Reserve (Fed), will keep interest rates higher for longer. West Texas Intermediate (WTI) crude is up over 10% this week, hovering near $93 per barrel.
The US Dollar (USD) has also gained traction as safe-haven demand revives amid growing uncertainty that the conflict may not end anytime soon. The US Dollar Index (DXY), which tracks the Greenback’s value against a basket of six major currencies, is trading at over a one-week high around 98.57.
Meanwhile, US Treasury yields have firmed amid rising inflation concerns and diminishing expectations for Fed interest rate cuts, further supporting the Greenback and weighing on the non-yielding metal.
While the ceasefire extension announced by US President Donald Trump has eased fears of immediate escalation, the US-Iran standoff over the Strait of Hormuz continues to weigh on market sentiment. Tehran has accused the US naval blockade of violating the ceasefire and described it as a key obstacle to negotiations. At the same time, Iranian leaders have signaled they will not participate in peace talks “under the shadow of threats.”
Speaking to reporters in the Oval Office on Thursday, Trump said, “We’ll see what happens, we have no pressure,” adding that “Iran is under time pressure, not us.” He warned that if no agreement is reached, fighting could resume, saying, “I’ll finish it up militarily,” and added that US ships are “locked and loaded, and ready to go.”
With no signs of peace talks resuming anytime soon and the Strait of Hormuz remaining under a dual blockade, markets are likely to stay driven by geopolitical headlines, with elevated Oil prices continuing to feed into inflation expectations. This, in turn, is expected to keep the US Dollar and yields supported, limiting any meaningful recovery in Gold as markets continue to price in a higher-for-longer rate outlook.
Looking ahead, on the data front, the US economic calendar features a revision to the University of Michigan’s Consumer Sentiment Index for April, along with consumer expectations and the 1-year and 5-year inflation expectations.
Technical analysis: Bearish bias holds below the moving average cluster
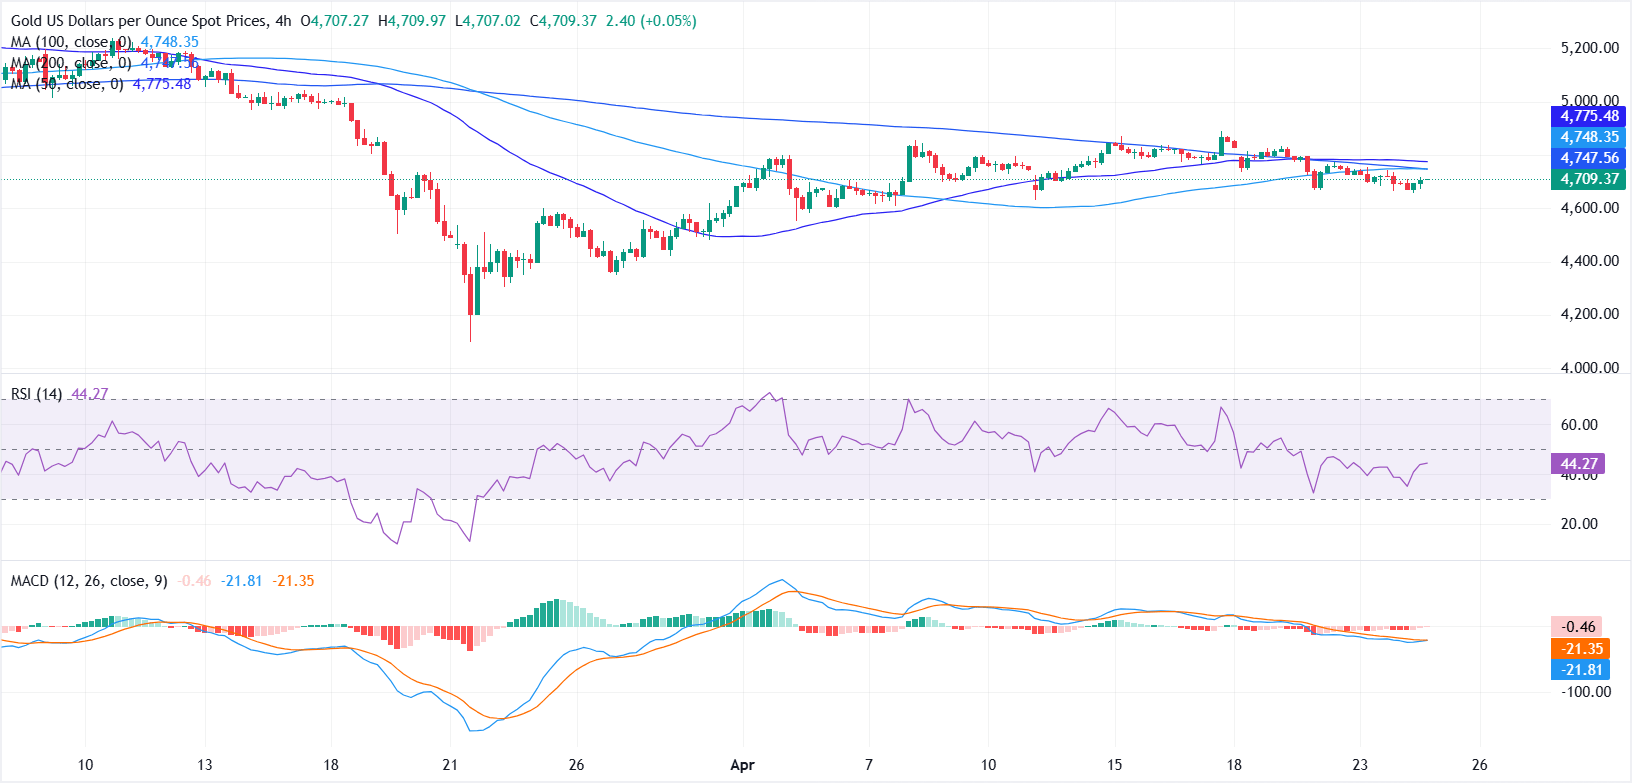
On the 4-hour chart, XAU/USD retains a bearish near-term bias as it continues to trade below key moving averages. The 100-period Simple Moving Average (SMA) at $4,748 and the 200-period SMA at $4,747, along with the 50-period SMA at $4,775, form a tight resistance cluster just overhead, reinforcing the broader downside tone.
Momentum indicators align with this view, with the Relative Strength Index (14) hovering near 44 in mildly negative territory and Moving Average Convergence Divergence (MACD) histogram still below the zero line, even as its negative reading moderates, hinting at waning but persistent selling pressure.
On the upside, any recovery is likely to remain capped below the moving average cluster between $4,750 and $4,775, where a sustained break above this zone could ease immediate downside pressure. On the downside, the $4,700-$4,650 zone is acting as immediate support, with a break below this area opening the door for deeper losses.
Gold FAQs
Gold has played a key role in human’s history as it has been widely used as a store of value and medium of exchange. Currently, apart from its shine and usage for jewelry, the precious metal is widely seen as a safe-haven asset, meaning that it is considered a good investment during turbulent times. Gold is also widely seen as a hedge against inflation and against depreciating currencies as it doesn’t rely on any specific issuer or government.
Central banks are the biggest Gold holders. In their aim to support their currencies in turbulent times, central banks tend to diversify their reserves and buy Gold to improve the perceived strength of the economy and the currency. High Gold reserves can be a source of trust for a country’s solvency. Central banks added 1,136 tonnes of Gold worth around $70 billion to their reserves in 2022, according to data from the World Gold Council. This is the highest yearly purchase since records began. Central banks from emerging economies such as China, India and Turkey are quickly increasing their Gold reserves.
Gold has an inverse correlation with the US Dollar and US Treasuries, which are both major reserve and safe-haven assets. When the Dollar depreciates, Gold tends to rise, enabling investors and central banks to diversify their assets in turbulent times. Gold is also inversely correlated with risk assets. A rally in the stock market tends to weaken Gold price, while sell-offs in riskier markets tend to favor the precious metal.
The price can move due to a wide range of factors. Geopolitical instability or fears of a deep recession can quickly make Gold price escalate due to its safe-haven status. As a yield-less asset, Gold tends to rise with lower interest rates, while higher cost of money usually weighs down on the yellow metal. Still, most moves depend on how the US Dollar (USD) behaves as the asset is priced in dollars (XAU/USD). A strong Dollar tends to keep the price of Gold controlled, whereas a weaker Dollar is likely to push Gold prices up.
추천 기사


