

Gold steady near $4,800 as US-Iran deal hopes grow, Fed rate cut bets return
- Gold steadies on Friday, on track for fourth straight weekly gain as US-Iran deal hopes build.
- Softer US Dollar and revived Fed rate cut expectations help cap downside in XAU/USD.
- Technically, XAU/USD consolidates within tightening Bollinger Bands, signaling a potential breakout ahead.
Gold (XAU/USD) holds steady on Friday as expectations grow around a potential US-Iran peace agreement. At the time of writing, XAU/USD is trading around $4,807, up nearly 0.35% on the day, and remains on track for a fourth consecutive weekly gain.
US-Iran deal hopes build
Investor sentiment improved after US President Donald Trump signaled progress on diplomatic efforts with Iran. “It’s looking very good that we’re going to make a deal with Iran, and it’s going to be a good deal,” Trump told reporters at the White House on Thursday. He added that the next round of talks could take place over the weekend and indicated he would consider extending the current ceasefire if both sides are close to reaching an agreement.
Trump also claimed that “they’ve agreed to almost everything,” including handing over what he described as “nuclear dust,” though there has been no confirmation of this from the Iranian side. These remarks follow his announcement of a 10-day ceasefire between Israel and Lebanon, reinforcing hopes of broader de-escalation in the region.
According to Reuters, a Pakistani source involved in mediating between the US and Iran said on Friday there was progress in backdoor diplomacy and that an upcoming meeting between the two sides could result in the signing of a memorandum of understanding followed by a comprehensive deal within 60 days.
Despite signs of easing tensions, Gold remains largely range-bound. The prospect of a deal has lifted risk appetite, with gains in global equities limiting flows into the metal. At the same time, a softer US Dollar (USD) is helping contain the downside in XAU/USD.
The US Dollar Index (DXY), which tracks the Greenback's value against a basket of six major currencies, is trading near 98.13, hovering around more than one-month lows and on track for a third consecutive weekly decline.
Fed interest rate cut bets return as Oil cools
Meanwhile, markets are also reassessing the Federal Reserve (Fed) monetary policy path as Oil prices trim some geopolitical risk premium on hopes that the Iran conflict may be nearing an end.
This has helped ease immediate inflation concerns and revive expectations that the Fed could lower interest rates later this year. Lower interest rates tend to support non-yielding assets such as Gold.
Looking ahead, traders will closely monitor weekend developments around US-Iran talks, particularly any progress toward reopening the Strait of Hormuz, which remains under a dual blockade by US forces and Iran, keeping energy flows disrupted.
On the data front, the US economic calendar is quiet, with no major releases. Attention will instead turn to speeches from Fed officials, ahead of the blackout period for the upcoming FOMC meeting scheduled for April 28-29.
Technical analysis: XAU/USD consolidates as Bollinger Bands tighten, breakout in focus
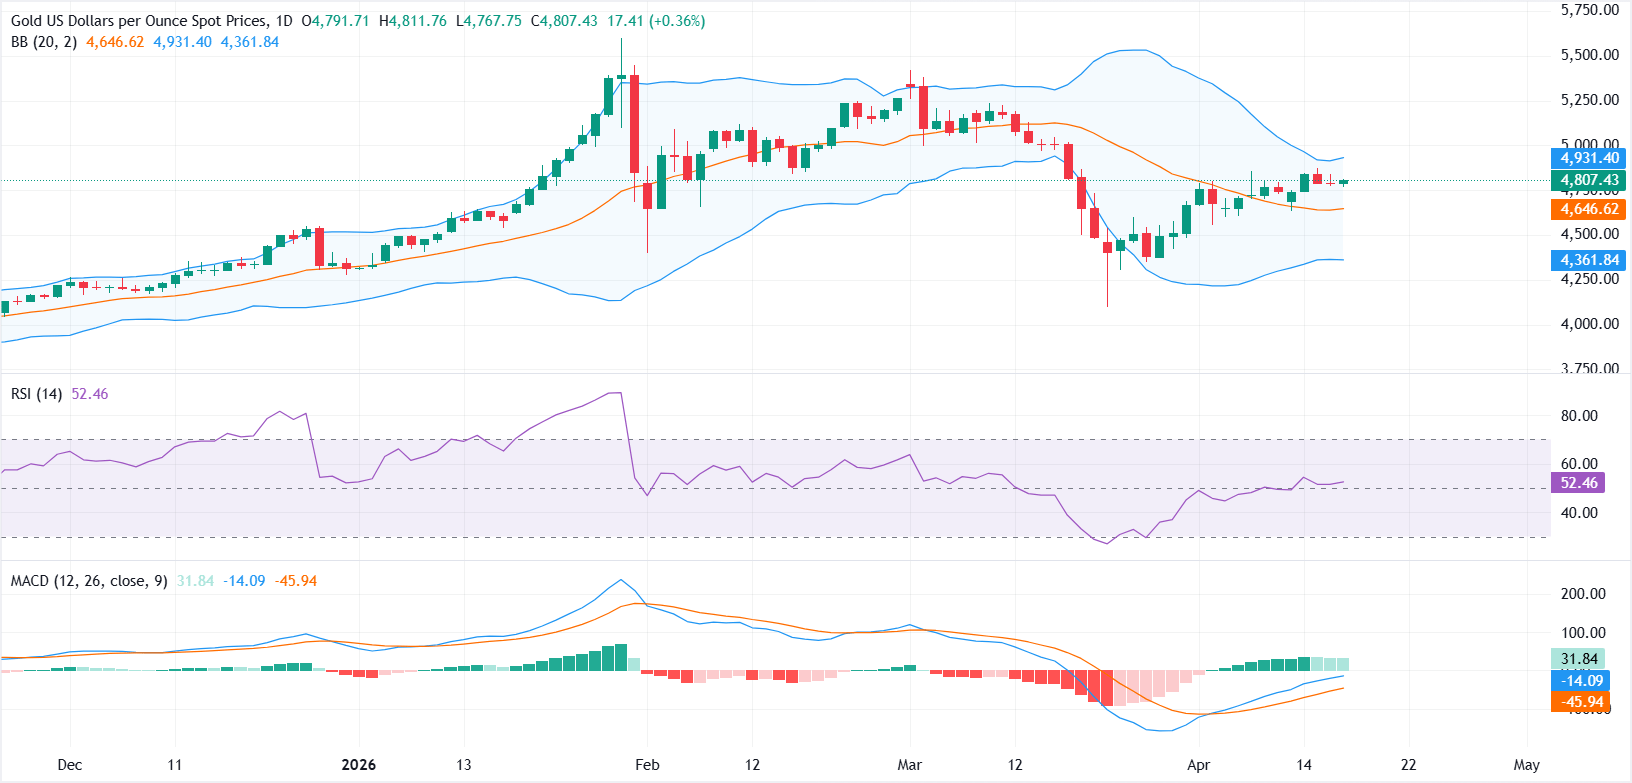
In the daily chart, XAU/USD holds well above the 20-day Simple Moving Average (SMA) from the Bollinger Bands at $4,646, keeping the near-term bias constructive. The recent narrowing of the bands indicates reduced volatility and a potential buildup before the next move.
The Relative Strength Index (RSI 14) is hovering near 52, close to the neutral 50 level. This reflects balanced momentum, with neither buyers nor sellers in clear control. The recovery from earlier oversold conditions suggests downside pressure has eased while the Moving Average Convergence Divergence (MACD) stays in positive territory, suggesting that bullish momentum is still present.
On the topside, immediate resistance is located at the Bollinger upper band near $4,931, where fresh supply could reappear if buyers regain traction. On the downside, initial support is reinforced by the Bollinger middle band/20-day SMA at $4,646 ahead of a deeper cushion at the lower band around $4,361, which should limit a more pronounced correction while the broader uptrend remains intact.
(The technical analysis of this story was written with the help of an AI tool.)
Gold FAQs
Gold has played a key role in human’s history as it has been widely used as a store of value and medium of exchange. Currently, apart from its shine and usage for jewelry, the precious metal is widely seen as a safe-haven asset, meaning that it is considered a good investment during turbulent times. Gold is also widely seen as a hedge against inflation and against depreciating currencies as it doesn’t rely on any specific issuer or government.
Central banks are the biggest Gold holders. In their aim to support their currencies in turbulent times, central banks tend to diversify their reserves and buy Gold to improve the perceived strength of the economy and the currency. High Gold reserves can be a source of trust for a country’s solvency. Central banks added 1,136 tonnes of Gold worth around $70 billion to their reserves in 2022, according to data from the World Gold Council. This is the highest yearly purchase since records began. Central banks from emerging economies such as China, India and Turkey are quickly increasing their Gold reserves.
Gold has an inverse correlation with the US Dollar and US Treasuries, which are both major reserve and safe-haven assets. When the Dollar depreciates, Gold tends to rise, enabling investors and central banks to diversify their assets in turbulent times. Gold is also inversely correlated with risk assets. A rally in the stock market tends to weaken Gold price, while sell-offs in riskier markets tend to favor the precious metal.
The price can move due to a wide range of factors. Geopolitical instability or fears of a deep recession can quickly make Gold price escalate due to its safe-haven status. As a yield-less asset, Gold tends to rise with lower interest rates, while higher cost of money usually weighs down on the yellow metal. Still, most moves depend on how the US Dollar (USD) behaves as the asset is priced in dollars (XAU/USD). A strong Dollar tends to keep the price of Gold controlled, whereas a weaker Dollar is likely to push Gold prices up.
추천 기사


