

Gold rises as US Treasury yields ease while Middle East tensions escalate
- Gold edges higher on Monday as US Treasury yields ease slightly, offering support amid a shifting monetary policy outlook.
- Iran-backed Houthis enter the conflict, raising risks of broader regional war.
- XAU/USD turns neutral to mildly bullish, with price rebounding from the 200-day SMA and eyeing the 100-day SMA.
Gold (XAU/USD) regains traction on Monday, reversing earlier intraday losses, as escalating tensions in the Middle East and shifting interest rate expectations keep markets volatile. At the time of writing, XAU/USD is trading around $4,576 after touching a low of $4,419 during the Asian session.
Gold steadies as yields ease and Fed outlook shifts
Price action is stabilizing near recent highs, with Monday’s rebound supported by a modest pullback in US Treasury yields after a recent surge to multi-month highs.
Despite the pullback in yields, they remain elevated overall, while the US Dollar (USD) continues to hold firm, limiting the upside in XAU/USD.
Markets are now reassessing the Federal Reserve’s (Fed) monetary policy outlook. Earlier, rising Oil prices had pushed expectations that the Fed could turn hawkish to tackle inflation, prompting traders to price in possible rate hikes later this year.
However, the focus is now shifting, as investors grow increasingly concerned about the impact of high energy prices on economic growth. According to the CME FedWatch Tool, markets expect the Fed to keep interest rates steady at 3.50%-3.75% through 2026.
Against this backdrop, a meaningful recovery in Gold appears unlikely. The metal remains down nearly 15% from its March peak of $5,419 and is on track to snap a seven-month winning streak in March. A higher interest rate environment for longer continues to raise the opportunity cost of holding non-yielding assets like Gold, making it less attractive to investors.
War intensifies as Houthis join the conflict
On the geopolitical front, the US-Israel war with Iran continues to intensify despite reports of ongoing negotiations. Over the weekend, Iran-backed Houthi militants entered the conflict, launching missile and drone attacks on Israel, opening a new front in the war.
This has raised fears they could target ships in the Red Sea, which could worsen existing disruptions to Oil flows through the Strait of Hormuz.
Meanwhile, US President Donald Trump told the Financial Times on Sunday that he would be willing to seize Iran’s Kharg Island, a key oil export hub. Separately, the Wall Street Journal reported on Monday that Trump is weighing a military operation to extract Iran’s uranium.
These developments come as the Pentagon is reportedly preparing for weeks of ground operations in Iran, while the US increases its military presence in the region, deploying thousands of troops.
Looking ahead, US economic data will be in focus this week. Attention will be on the March Manufacturing Purchasing Managers' Index (PMI) and the Nonfarm Payrolls (NFP) report.
Technical analysis: 100-day SMA in focus
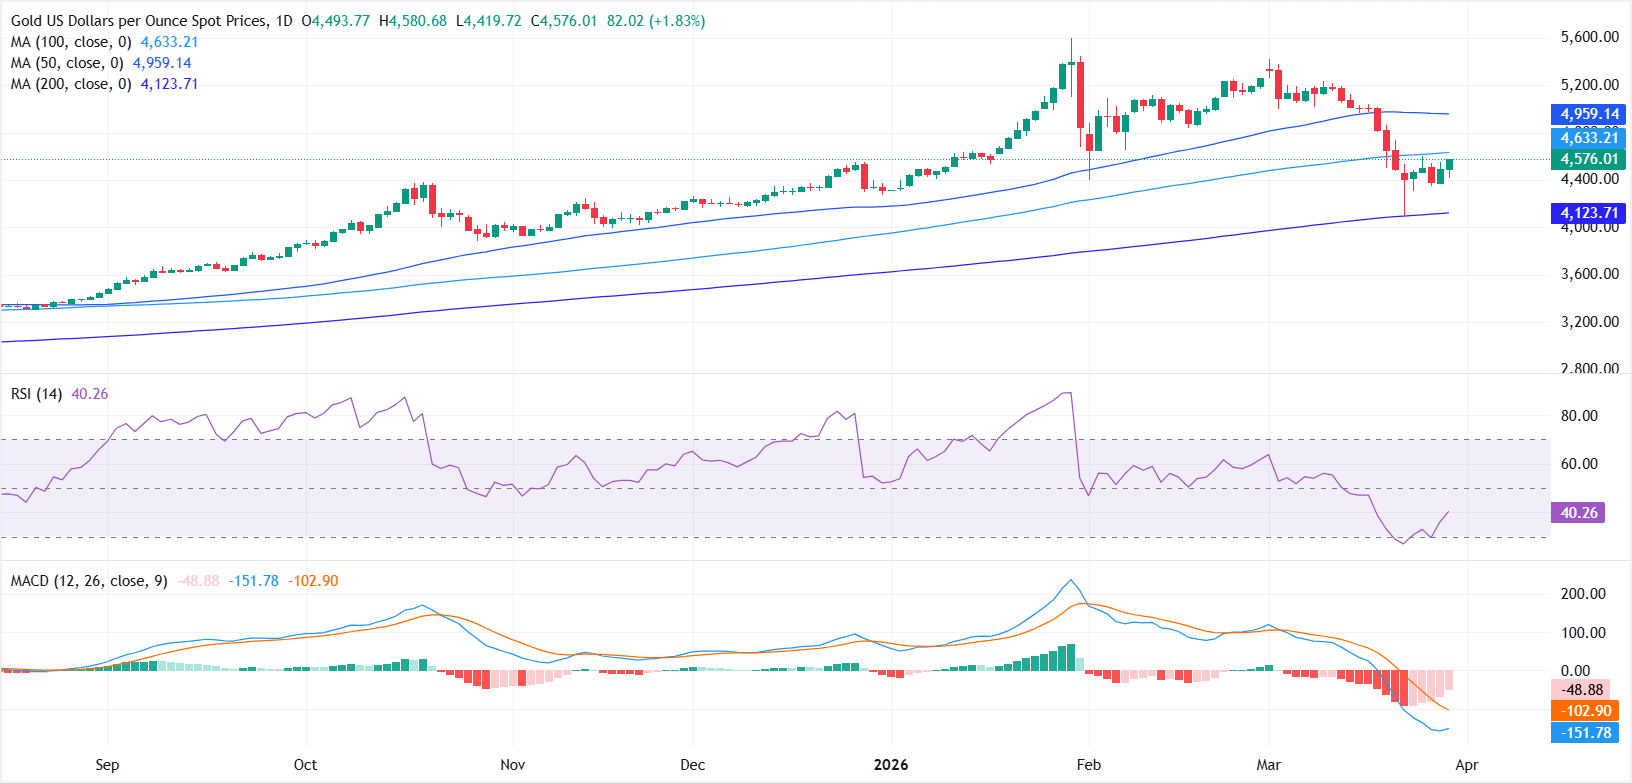
From a technical perspective, the near-term bias for XAU/USD is turning neutral to mildly bullish, as prices move back toward the 100-day Simple Moving Average (SMA) after rebounding from the 200-day SMA last week.
Momentum indicators are also showing early signs of recovery. The Relative Strength Index (RSI) is hovering near the 40 mark, bouncing from oversold territory, suggesting that selling pressure may be easing.
Meanwhile, the Moving Average Convergence Divergence (MACD) remains in negative territory, with the MACD line below the signal line, but the fading histogram points to weakening downside momentum.
On the upside, a clear break above the 100-day SMA near $4,633 could open the door for a move toward the 50-day SMA around $4,958. On the downside, immediate support is seen in the $4,400-$4,300 zone, followed by the 200-day SMA near $4,123.
Gold FAQs
Gold has played a key role in human’s history as it has been widely used as a store of value and medium of exchange. Currently, apart from its shine and usage for jewelry, the precious metal is widely seen as a safe-haven asset, meaning that it is considered a good investment during turbulent times. Gold is also widely seen as a hedge against inflation and against depreciating currencies as it doesn’t rely on any specific issuer or government.
Central banks are the biggest Gold holders. In their aim to support their currencies in turbulent times, central banks tend to diversify their reserves and buy Gold to improve the perceived strength of the economy and the currency. High Gold reserves can be a source of trust for a country’s solvency. Central banks added 1,136 tonnes of Gold worth around $70 billion to their reserves in 2022, according to data from the World Gold Council. This is the highest yearly purchase since records began. Central banks from emerging economies such as China, India and Turkey are quickly increasing their Gold reserves.
Gold has an inverse correlation with the US Dollar and US Treasuries, which are both major reserve and safe-haven assets. When the Dollar depreciates, Gold tends to rise, enabling investors and central banks to diversify their assets in turbulent times. Gold is also inversely correlated with risk assets. A rally in the stock market tends to weaken Gold price, while sell-offs in riskier markets tend to favor the precious metal.
The price can move due to a wide range of factors. Geopolitical instability or fears of a deep recession can quickly make Gold price escalate due to its safe-haven status. As a yield-less asset, Gold tends to rise with lower interest rates, while higher cost of money usually weighs down on the yellow metal. Still, most moves depend on how the US Dollar (USD) behaves as the asset is priced in dollars (XAU/USD). A strong Dollar tends to keep the price of Gold controlled, whereas a weaker Dollar is likely to push Gold prices up.
추천 기사


