


Bitcoin Weekly Forecast: The uncertainty from war (finally) weighs
- Bitcoin price trades in the red on Friday, nearly erasing its recovery from earlier in the week.
- Mixed ETF flows with a slight bearish tilt suggests caution amid growing uncertainty over the US-Iran ceasefire talks.
- Reports suggest that Strategy remains the sole corporate BTC buyer amid current market conditions, as other major firms have failed to sustain demand.
Bitcoin (BTC) slips below $69,000 as of writing on Friday, nearly wiping out its recovery from earlier this week. Growing uncertainty over the US-Iran ceasefire plan and a slight bearish bias among institutional investors faded the Crypto King’s rebound, signaling cautious traders and no clear direction bias for the largest cryptocurrency by market capitalization.
Deal or no deal, BTC could experience volatility
Bitcoin began the week on a positive note, recovering nearly 5% on Monday after losses the previous week due to macroeconomic headwinds.
Monday’s rebound came in after US President Donald Trump directed the Department of War to suspend attacks on Iran’s power plants and energy infrastructure for a five-day period, citing productive talks between the two nations.
These developments amid the ongoing Middle East war boosted risk sentiment, with US equities and other risky assets such as BTC closing higher on Monday.
However, as the week advanced, uncertainty around the ceasefire talks remains elevated. Early Thursday, Trump reiterated that Iran is engaged in negotiations to end the conflict.
“They are negotiating, by the way, and they want to make a deal so badly. But they’re afraid to say it, because they figure they’ll be killed by their own people,” Trump said.
While the comments from Iranian Foreign Minister Abbas Araghchi on state TV stated that his government had not engaged in talks to end the war, citing that “we do not plan on any negotiations.”
These mixed signals from both sides continued to cloud the outlook, with US equities erasing their Monday recovery while BTC also fell.
Later this week, Trump said Washington would pause attacks on Iran’s energy sector for 10 days, until April 6, at Tehran’s request. However, Iran denied making such a request, underscoring the fragility of diplomacy and the low likelihood of a near-term ceasefire.
Traders should be cautious, as negotiations around the ceasefire deal remain highly uncertain, with the latest news suggesting a slight negative outcome that could bring fresh volatility to risky assets. BTC continues to trade in the red as of writing on Friday, below $69,000.
Institutional demand tilts slightly bearish
Institutional flows reflect the mixed market sentiment, with a slight bearish bias so far this week. SoSoValue data show that Bitcoin spot Exchange Traded Funds (ETFs) have seen alternating inflows and outflows this week, beginning with positive flows of $167.23 million on Monday, followed by an outflow of $74.53 million on Tuesday, a mild inflow of $7.81 million on Wednesday, and then a $171.22 million negative flow on Thursday.
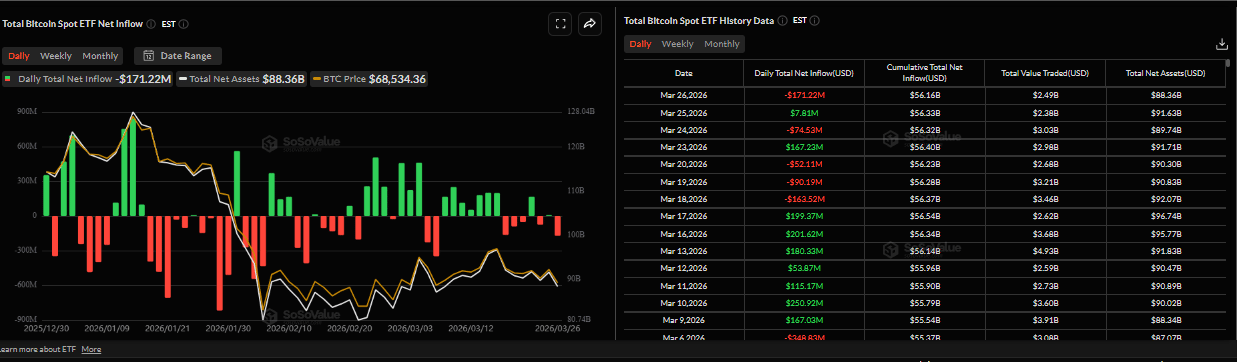
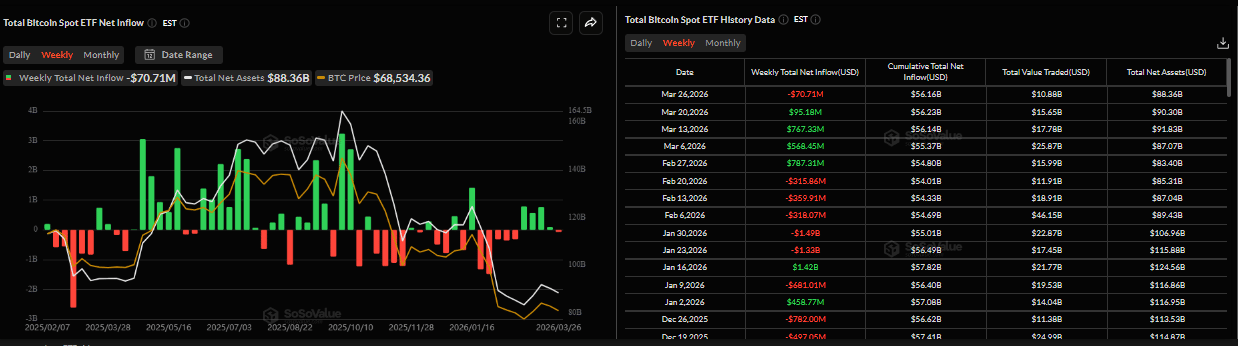
As of Thursday, net flows show a slight bearish trend, with a total net outflow of $70.71 million this week. If these outflows continue on Friday, the week will end on a negative note, breaking the four-week streak of positive flows, which could lead to further correction toward the Crypto King.
On the corporate side, Michael Saylor announced on X on Monday that Strategy (MSTR) had purchased another 1,031 BTC for $76.6 million following its purchase of 22,337 BTC the previous week. Monday’s purchase brings the firm’s total holdings to 762,099 BTC, highlighting its continued aggressive accumulation strategy despite uncertainty in global markets. Strategy’s average purchase price for all its holdings is $75,694, above the current market price.
Strategy is the sole buyer of BTC in current conditions
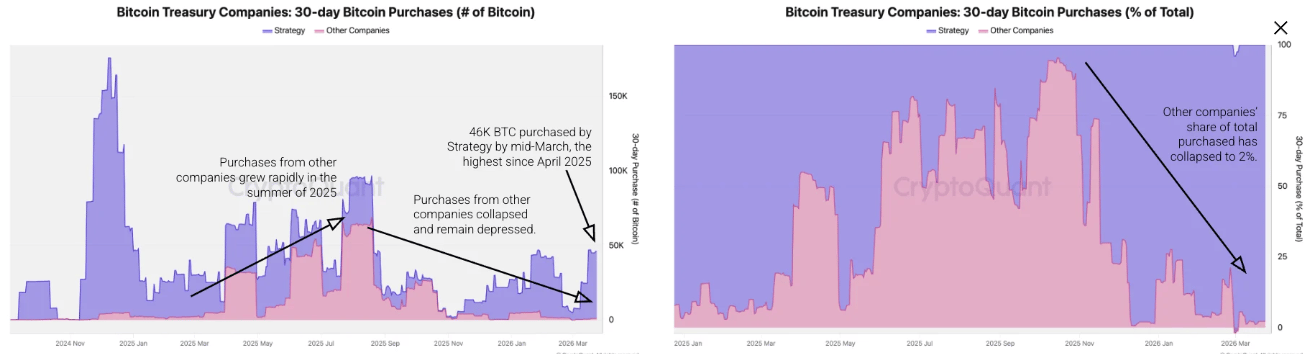
Looking deeper into the Strategy’s recent purchase, CryptoQuant’s weekly report highlighted that MSTR is the sole driver of Bitcoin treasury demand.
The report explained that MSTR has accumulated more than 45,000 BTC in the last 30 days, the highest 30-day purchase since April 2025. On the contrary, BTC purchases from all other treasury companies have collapsed, totaling 1,000 BTC in the last 30 days, a 99% decline from the high of 69,000 BTC in August 2025. Moreover, the share of purchases from these other treasury companies has declined to 2%, from 95% in October last year.
“As a result of the above dynamics, Strategy’s holdings reached new record-highs, while the holdings of the other companies have stalled,” the report highlighted.
In an exclusive interview, Julio Moreno, Head of Research at CryptoQuant, told FXStreet that “I don’t think that Strategy by itself can support Bitcoin’s price for long. To support the price of Bitcoin, overall demand needs to grow, which is not the case today,” when asked about the Strategy’s current aggressive accumulation.
In addition, Moreno shared his analysis in the chart below: "Right now, Bitcoin demand excluding ETFs and Strategy contracted by 452K BTC in the last 30 days, as shown in the violet area of the chart."
-1774599679806-1774599679807.png)
Option expiry worth $13 billion
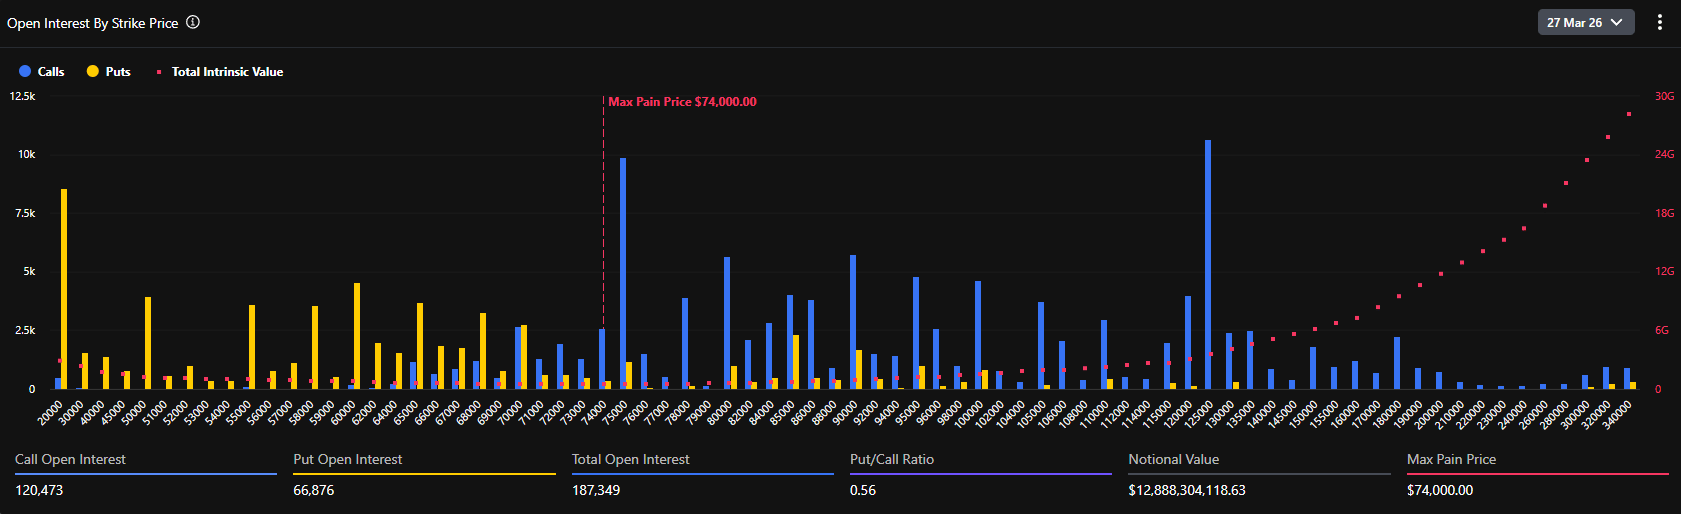
According to Deribit data, $12.88 billion in BTC options is going to be settled on Friday. The chart below shows that the "max pain price" currently sits around $74,000, which is above the current trading level near $69,000. As expiry approaches, markets tend to gravitate toward the level where the most options expire worthless (at $74,000), suggesting the BTC price could increase to this level. However, traders should be cautious as the current conditions suggest this pull may not fully materialize, leaving room for continued downside pressure.
Technical outlook hints at a cautionary tone
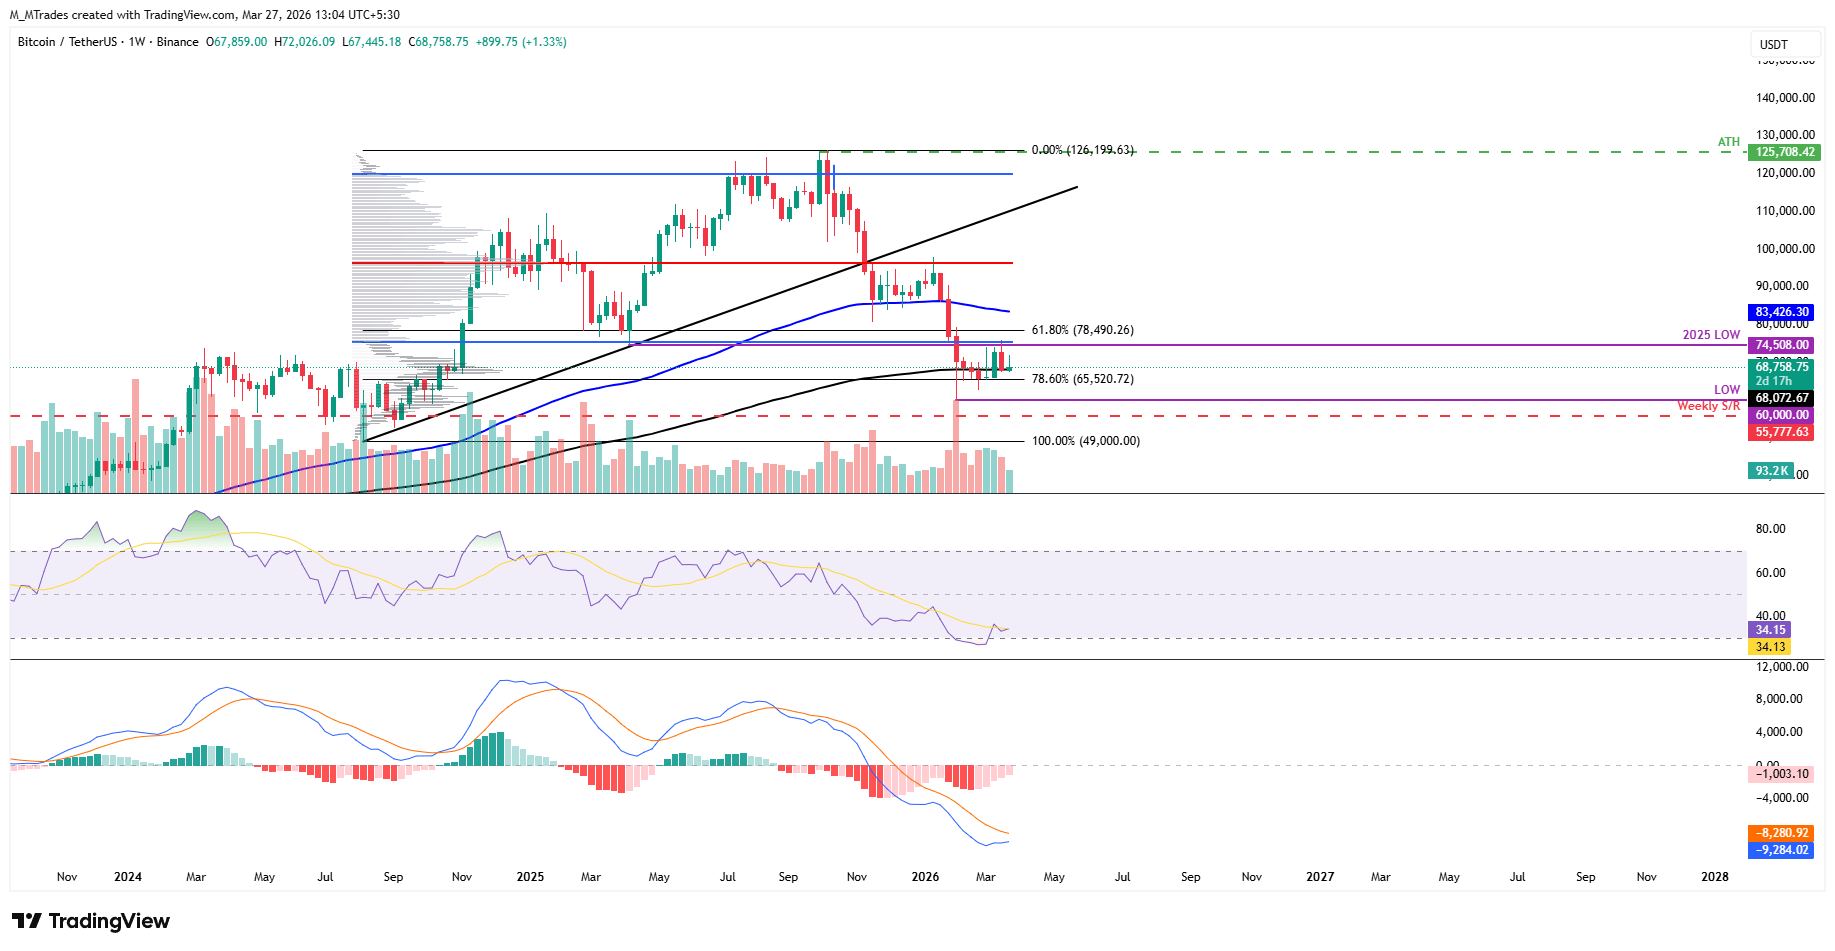
As seen on the weekly chart below, the largest cryptocurrency by market capitalization faced rejection around the 2025 yearly low of $74,508 last week and found support around the 200-week Exponential Moving Average (EMA) at $68,072. At the time of writing on Friday, BTC hovers near this dynamic support level.
If the 200-week EMA at $60,072 fails to hold as support, Bitcoin could extend the correction toward the 78.60% Fibonacci retracement level at $65,520 (drawn from the August 2024 low of $49,000 to the October 2025 all-time high of $126,199).
The Relative Strength Index (RSI) reads 34 on the weekly chart, below the neutral level of 50 and near oversold territory, indicating persistent but not yet exhausted bearish momentum. The Moving Average Convergence Divergence (MACD) indicator on the same chart also showed a bearish crossover in mid-August, which remains intact, supporting the negative outlook. Still, contracting red histogram bars, as the MACD line approaches its signal line, suggest easing bearish pressure.
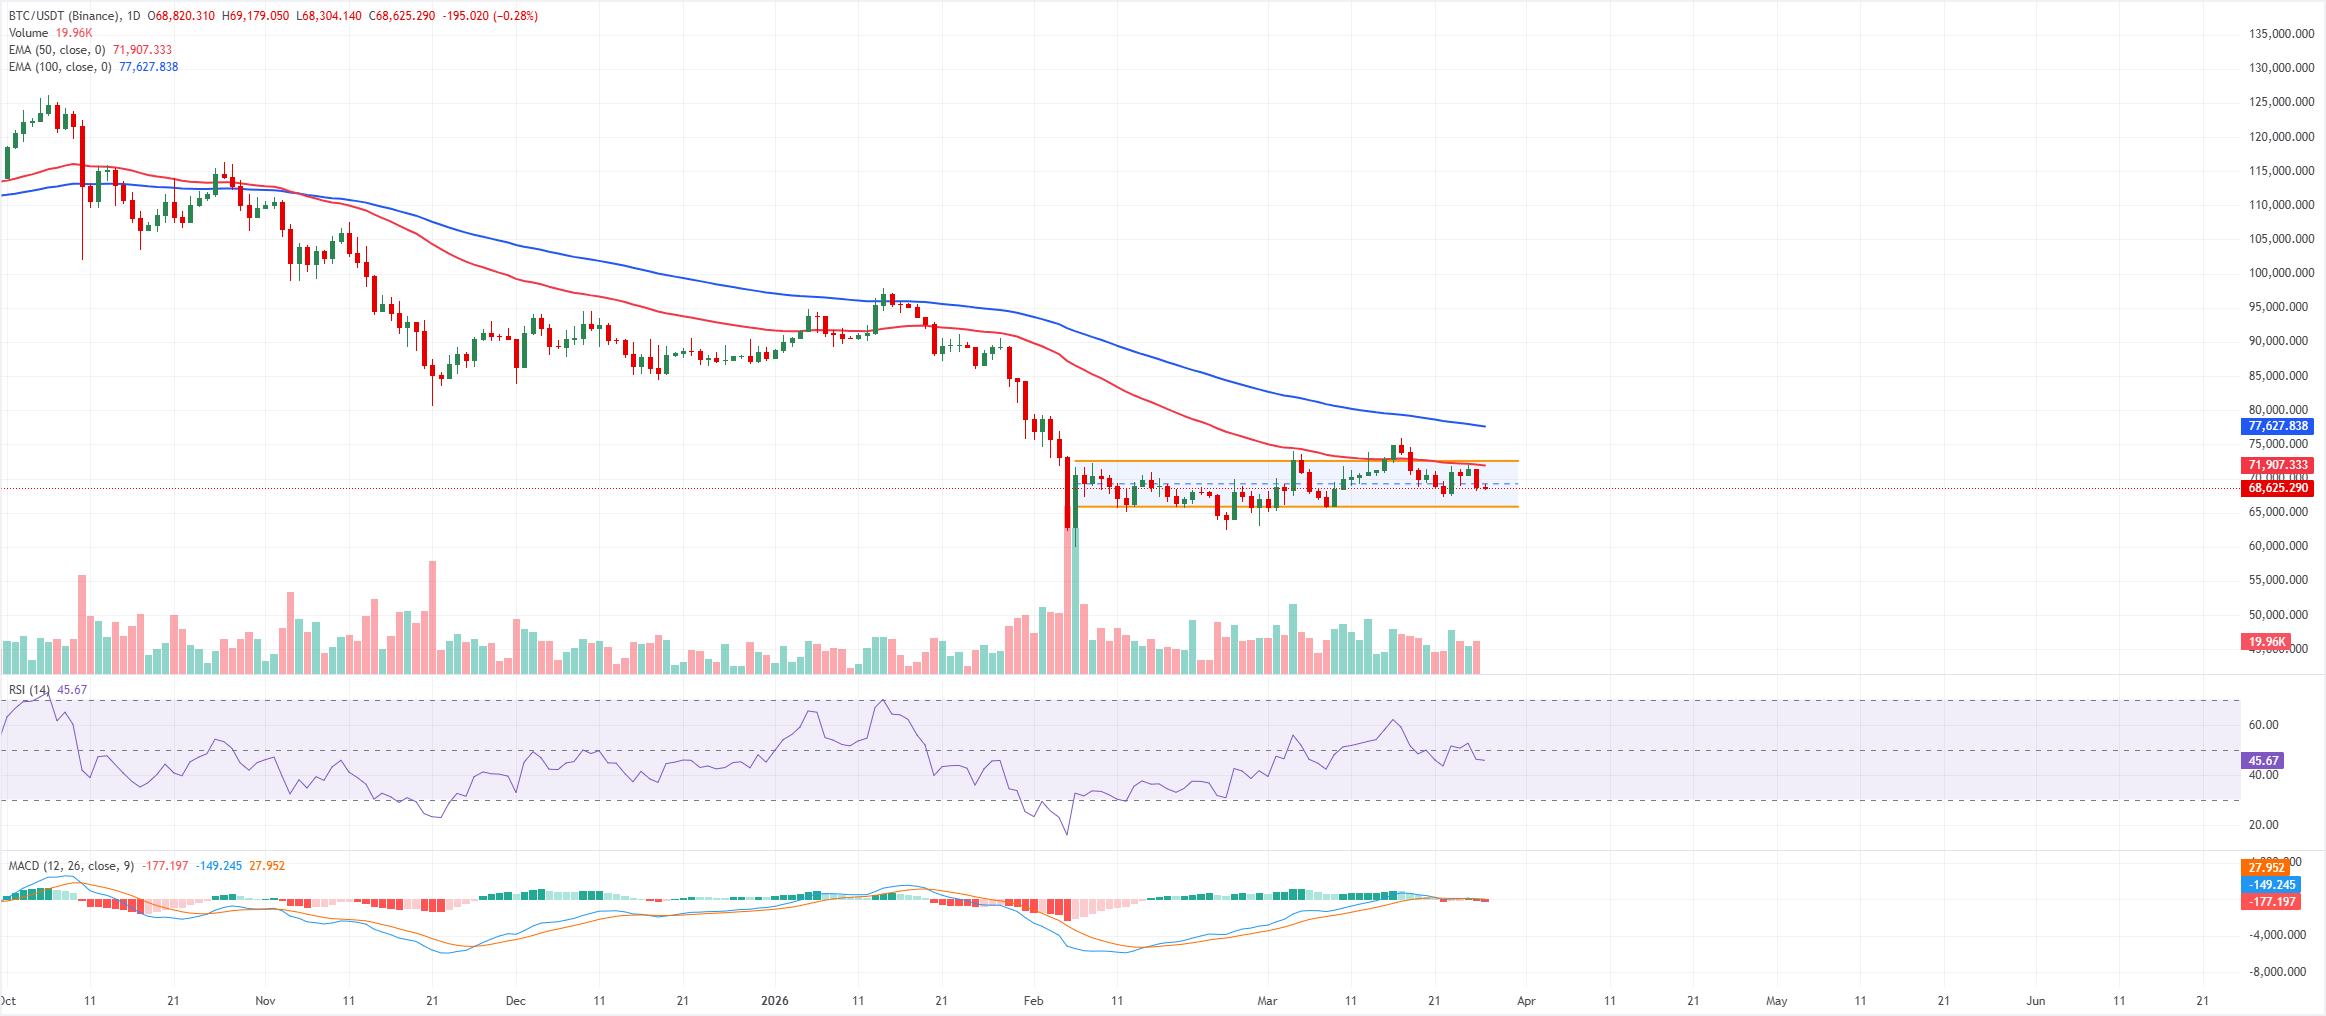
On the daily chart, the near-term bias is cautiously bearish for the Crypto King, as price trades below the horizontal channel midpoint of $69,000. BTC also remains well below the 50-day and 100-day EMA clustered between $71,900 and $77,600, respectively, which continue to cap the broader upside and frame the current advance as a corrective bounce within a broader downtrend.
Momentum leans slightly bearish, as the RSI on the daily chart hovers in the mid-40s, reflecting limited buying pressure, while the MACD indicator histogram has shifted modestly negative, suggesting early signs of downside momentum.
Initial resistance emerges at the channel top around $72,500, reinforced by the descending 50-day EMA near $71,900; a daily close above this area would be needed to weaken the bearish structure and open the way toward the 100-day EMA near $77,600.
On the downside, immediate support lies at Monday’s low around $67,500, followed by the channel base and the prior low near $65,900, where buyers previously stepped in. A break below $65,900 would confirm a fresh leg lower toward $60,000, a key psychological level.
(The technical analysis of this story was written with the help of an AI tool.)
Bitcoin, altcoins, stablecoins FAQs
Bitcoin is the largest cryptocurrency by market capitalization, a virtual currency designed to serve as money. This form of payment cannot be controlled by any one person, group, or entity, which eliminates the need for third-party participation during financial transactions.
Altcoins are any cryptocurrency apart from Bitcoin, but some also regard Ethereum as a non-altcoin because it is from these two cryptocurrencies that forking happens. If this is true, then Litecoin is the first altcoin, forked from the Bitcoin protocol and, therefore, an “improved” version of it.
Stablecoins are cryptocurrencies designed to have a stable price, with their value backed by a reserve of the asset it represents. To achieve this, the value of any one stablecoin is pegged to a commodity or financial instrument, such as the US Dollar (USD), with its supply regulated by an algorithm or demand. The main goal of stablecoins is to provide an on/off-ramp for investors willing to trade and invest in cryptocurrencies. Stablecoins also allow investors to store value since cryptocurrencies, in general, are subject to volatility.
Bitcoin dominance is the ratio of Bitcoin's market capitalization to the total market capitalization of all cryptocurrencies combined. It provides a clear picture of Bitcoin’s interest among investors. A high BTC dominance typically happens before and during a bull run, in which investors resort to investing in relatively stable and high market capitalization cryptocurrency like Bitcoin. A drop in BTC dominance usually means that investors are moving their capital and/or profits to altcoins in a quest for higher returns, which usually triggers an explosion of altcoin rallies.
추천 기사


