

Gold range-bound as traders weigh Fed outlook, geopolitical risks
- Gold trades with a negative bias on Monday amid mixed fundamentals and a firmer Dollar.
- Softer inflation and resilient labour market data in the US reinforce expectations for more than 50 bps of Fed easing later this year.
- An ascending triangle on the daily chart keeps $5,100 as the key breakout level, while $4,900 acts as near-term support.
Gold (XAU/USD) kicks off the week on a subdued note, extending its consolidation phase as traders remain reluctant to chase prices higher amid mixed macro signals. At the time of writing, XAU/USD is trading near $5,004, bouncing from an intraday low around $4,965, down roughly 0.55% on the day.
Inflation cools, labour market firms as traders price gradual easing
A modest uptick in the US Dollar (USD) is weighing on Bullion. Meanwhile, last week’s US economic releases trimmed expectations for an imminent Federal Reserve (Fed) interest rate cut, further capping upside attempts in Gold. That said, expectations for monetary policy easing in the second half of the year continue to offer underlying support to the non-yielding metal.
US Consumer Price Index (CPI) data came in softer than expected. Headline CPI rose 0.2% MoM in January, slowing from 0.3% in December. On an annual basis, inflation eased to 2.4% YoY from 2.7%.
Meanwhile, the Nonfarm Payrolls (NFP) increased by 130K, well above December’s revised 48K gain, while the Unemployment Rate edged down to 4.3% from 4.4%.
Taken together, the latest labour market and inflation data suggest the Fed’s dual mandate is moving in the right direction, with labour conditions stabilising and price pressure gradually moderating. As a result, traders have increased their bets on more than 50 basis points (bps) of easing this year, with interest rate futures pricing in the first cut in June, according to the CME FedWatch tool.
Elsewhere, persistent geopolitical tensions continue to underpin safe-haven demand for Gold, with US-Iran developments remaining in focus. The BBC reported on Monday that Iran is willing to consider compromises to reach a nuclear agreement, provided Washington is open to discussing sanctions relief.
Iran’s Foreign Minister Abbas Araghchi has arrived in Geneva for a high-stakes second round of nuclear talks, with negotiations set to resume on Tuesday.
Against this backdrop, Gold could remain range-bound in the near term, with heightened volatility across the precious metals space discouraging aggressive positioning. Thin liquidity trading conditions due to the US Presidents’ Day holiday are also likely to keep price action choppy on Monday.
Looking ahead this week, attention will turn to Wednesday’s release of the minutes from the Federal Open Market Committee’s (FOMC) January meeting.
Focus will then shift to Friday’s US Personal Income and Spending report, which will include the latest reading on core Personal Consumption Expenditures (PCE) — the Fed’s preferred inflation gauge.
Markets will also assess the advance estimate of fourth-quarter Gross Domestic Product (GDP) for further clues on the timing of the next rate cut.
Technical analysis: Bullish structure intact, $5,100 breakout needed for trend continuation
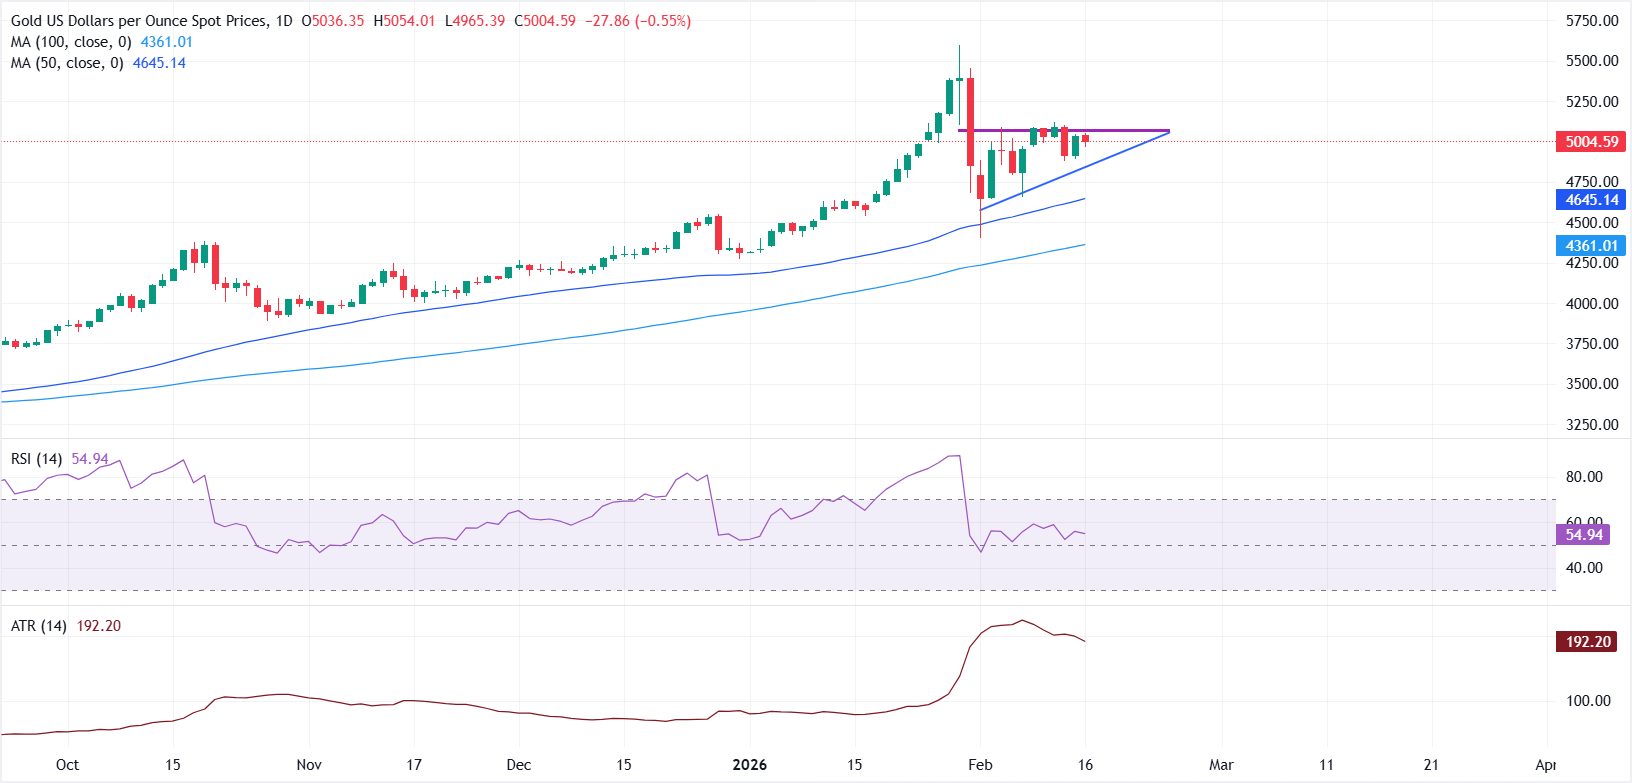
From a technical perspective, the daily chart shows an ascending triangle formation, with the $5,050-$5,100 region capping recovery attempts. The 50-day Simple Moving Average (SMA) remains above the 100-day SMA, reinforcing the broader bullish structure.
Both moving averages are sloping upward, while the price continues to trade comfortably above them, suggesting buyers retain control.
The Relative Strength Index (RSI) stands at 54.94, hovering in neutral territory with a slight positive bias. Meanwhile, the Average True Range (ATR) remains elevated but has eased to 192.20, pointing to moderating volatility following recent sharp swings.
On the upside, a sustained break above $5,100 would confirm a bullish breakout from the ascending triangle and signal continuation of the prevailing uptrend.
On the downside, initial support is seen around the $4,900-$4,880 zone. A deeper pullback could expose the 50-day SMA at $4,645 with a further decline opening the door toward the 100-day SMA near $4,361.
Gold FAQs
Gold has played a key role in human’s history as it has been widely used as a store of value and medium of exchange. Currently, apart from its shine and usage for jewelry, the precious metal is widely seen as a safe-haven asset, meaning that it is considered a good investment during turbulent times. Gold is also widely seen as a hedge against inflation and against depreciating currencies as it doesn’t rely on any specific issuer or government.
Central banks are the biggest Gold holders. In their aim to support their currencies in turbulent times, central banks tend to diversify their reserves and buy Gold to improve the perceived strength of the economy and the currency. High Gold reserves can be a source of trust for a country’s solvency. Central banks added 1,136 tonnes of Gold worth around $70 billion to their reserves in 2022, according to data from the World Gold Council. This is the highest yearly purchase since records began. Central banks from emerging economies such as China, India and Turkey are quickly increasing their Gold reserves.
Gold has an inverse correlation with the US Dollar and US Treasuries, which are both major reserve and safe-haven assets. When the Dollar depreciates, Gold tends to rise, enabling investors and central banks to diversify their assets in turbulent times. Gold is also inversely correlated with risk assets. A rally in the stock market tends to weaken Gold price, while sell-offs in riskier markets tend to favor the precious metal.
The price can move due to a wide range of factors. Geopolitical instability or fears of a deep recession can quickly make Gold price escalate due to its safe-haven status. As a yield-less asset, Gold tends to rise with lower interest rates, while higher cost of money usually weighs down on the yellow metal. Still, most moves depend on how the US Dollar (USD) behaves as the asset is priced in dollars (XAU/USD). A strong Dollar tends to keep the price of Gold controlled, whereas a weaker Dollar is likely to push Gold prices up.
추천 기사


