

Gold drifts lower amid sustained USD buying as traders await delayed US NFP report
- Gold struggles to capitalize on modest intraday gains amid a combination of negative factors.
- Reduced Fed rate cut bets lift the USD to a multi-month top and cap the non-yielding bullion.
- The risk-on impulse also undermines the safe-haven commodity ahead of the US NFP report.
Gold (XAU/USD) attracts fresh sellers following an Asian session uptick to the $4,110 region on Thursday and retreats further from the weekly high, touched the previous day. Despite concerns about the weakening economic momentum on the back of the longest-ever US government shutdown, less dovish Federal Reserve (Fed) expectations lift the US Dollar (USD) to its highest level since late May. This, in turn, is seen as a key factor exerting downward pressure on the non-yielding yellow metal.
Apart from this, a generally positive tone around the equity markets is seen as another factor undermining demand for the safe-haven Gold. Traders, however, seem reluctant and opt to wait for the delayed release of the US Nonfarm Payrolls (NFP) report for September for a fresh directional impetus later during the North American session. Nevertheless, the fundamental backdrop warrants caution before positioning for an extension of this week's bounce from levels below the $4,000 psychological mark.
Daily Digest Market Movers: Gold bulls seem reluctant as less dovish Fed expectations continue to push USD higher
- The minutes from the October 28-29 FOMC meeting, released on Wednesday, showed that many participants were in favor of lowering the target range for the federal funds rate, while several were against the decision. Policymakers cautioned that cutting interest rates further could risk entrenched inflation.
- The hawkish outlook forced investors to further scale back their bets that the US central bank will lower borrowing costs again in December. This, in turn, lifts the US Dollar to its highest level since late May during the Asian session on Thursday and exerts some downward pressure on the non-yielding Gold.
- Traders now look forward to the delayed release of the US Nonfarm Payrolls (NFP) report for September, due later today, amid signs of a softening labor market. The crucial data will play a key role in influencing the near-term USD price dynamics and provide a fresh directional impetus to the commodity.
- US President Donald Trump reportedly approved a 28-point plan for peace between Russia and Ukraine this week. Multiple news outlets suggested that the plan in question would require Ukraine to make territorial concessions and implement significant reductions in its military capabilities.
- The US delegation made a rare wartime visit to Kyiv for talks with Ukraine's leaders in an attempt to revive stalled peace talks with Russia. This is seen as another factor undermining the safe-haven precious metal and warrants some caution for bullish traders amid a fresh wave of the risk-on trade.
Gold needs to weaken below the 200-period EMA on H4 to back the case for deeper losses
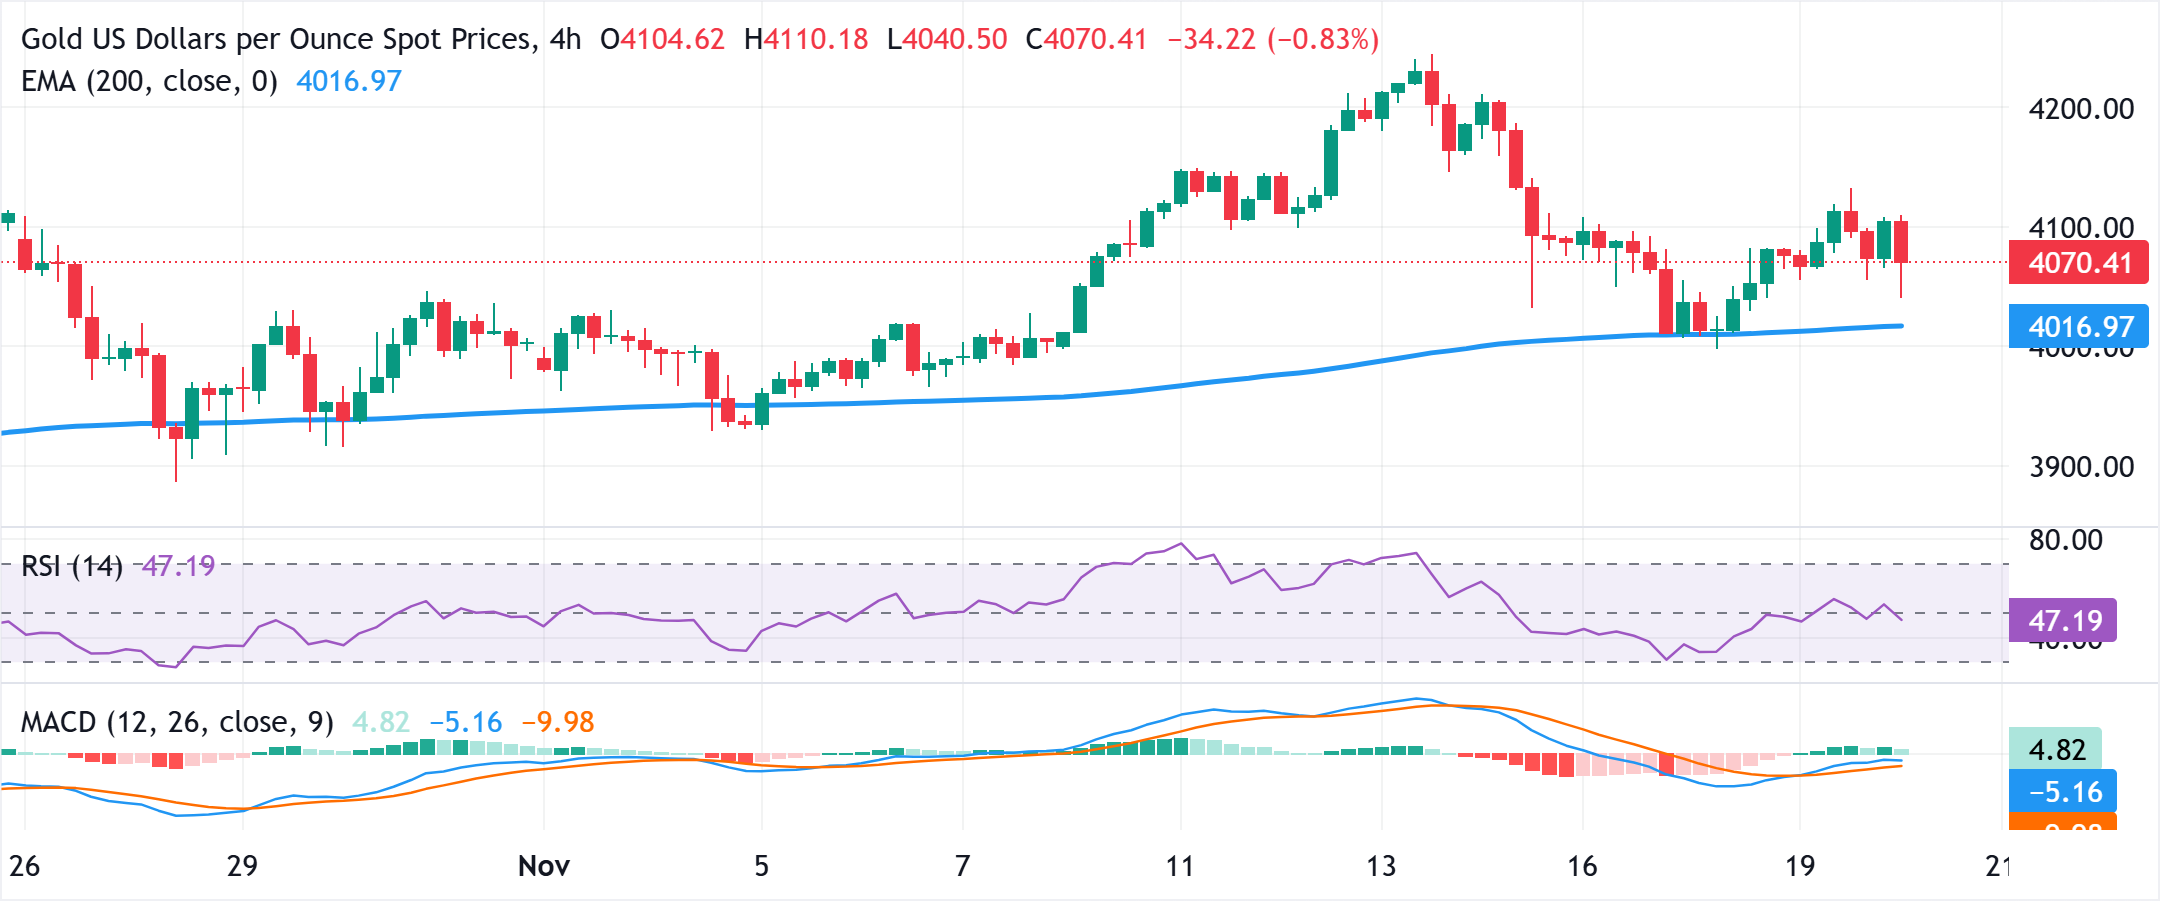
From a technical perspective, any further decline is more likely to find decent support near the 200-period Exponential Moving Average (EMA), currently pegged near the $4,018 region. This is followed by the weekly swing low, levels just below the $4,000 psychological mark, below which the Gold price could accelerate the fall towards the $3,931 support. The downward trajectory could extend further towards retesting the late October swing low, around the $3,886 region.
On the flip side, the Asian session peak, around the $4,110 region, could act as an immediate resistance. Some follow-through buying beyond the overnight swing high, around he $4,120 area, will be seen as a fresh trigger for bullish traders and lift the Gold price to the next relevant hurdle near the $4,152-4,155 region. The subsequent move up should pave the way for a move towards reclaiming the $4,200 round-figure mark.
US Dollar Price This week
The table below shows the percentage change of US Dollar (USD) against listed major currencies this week. US Dollar was the strongest against the Japanese Yen.
| USD | EUR | GBP | JPY | CAD | AUD | NZD | CHF | |
|---|---|---|---|---|---|---|---|---|
| USD | 0.96% | 0.89% | 1.84% | 0.26% | 0.86% | 1.27% | 1.63% | |
| EUR | -0.96% | 0.04% | 1.23% | -0.68% | -0.12% | 0.34% | 0.68% | |
| GBP | -0.89% | -0.04% | 0.94% | -0.72% | -0.15% | 0.30% | 0.64% | |
| JPY | -1.84% | -1.23% | -0.94% | -1.53% | -0.94% | -0.53% | -0.22% | |
| CAD | -0.26% | 0.68% | 0.72% | 1.53% | 0.60% | 1.02% | 1.37% | |
| AUD | -0.86% | 0.12% | 0.15% | 0.94% | -0.60% | 0.47% | 0.80% | |
| NZD | -1.27% | -0.34% | -0.30% | 0.53% | -1.02% | -0.47% | 0.34% | |
| CHF | -1.63% | -0.68% | -0.64% | 0.22% | -1.37% | -0.80% | -0.34% |
The heat map shows percentage changes of major currencies against each other. The base currency is picked from the left column, while the quote currency is picked from the top row. For example, if you pick the US Dollar from the left column and move along the horizontal line to the Japanese Yen, the percentage change displayed in the box will represent USD (base)/JPY (quote).
추천 기사


