

Dow Jones Industrial Average toys with further downside on Wednesday
- The Dow Jones is struggling to find a foothold near 46,000.
- Equities are on the defensive ahead of after-market earnings call for key AI supplier Nvidia.
- Fed rate cut expectations evaporate as BLS cancels October NFP data citing collection issues.
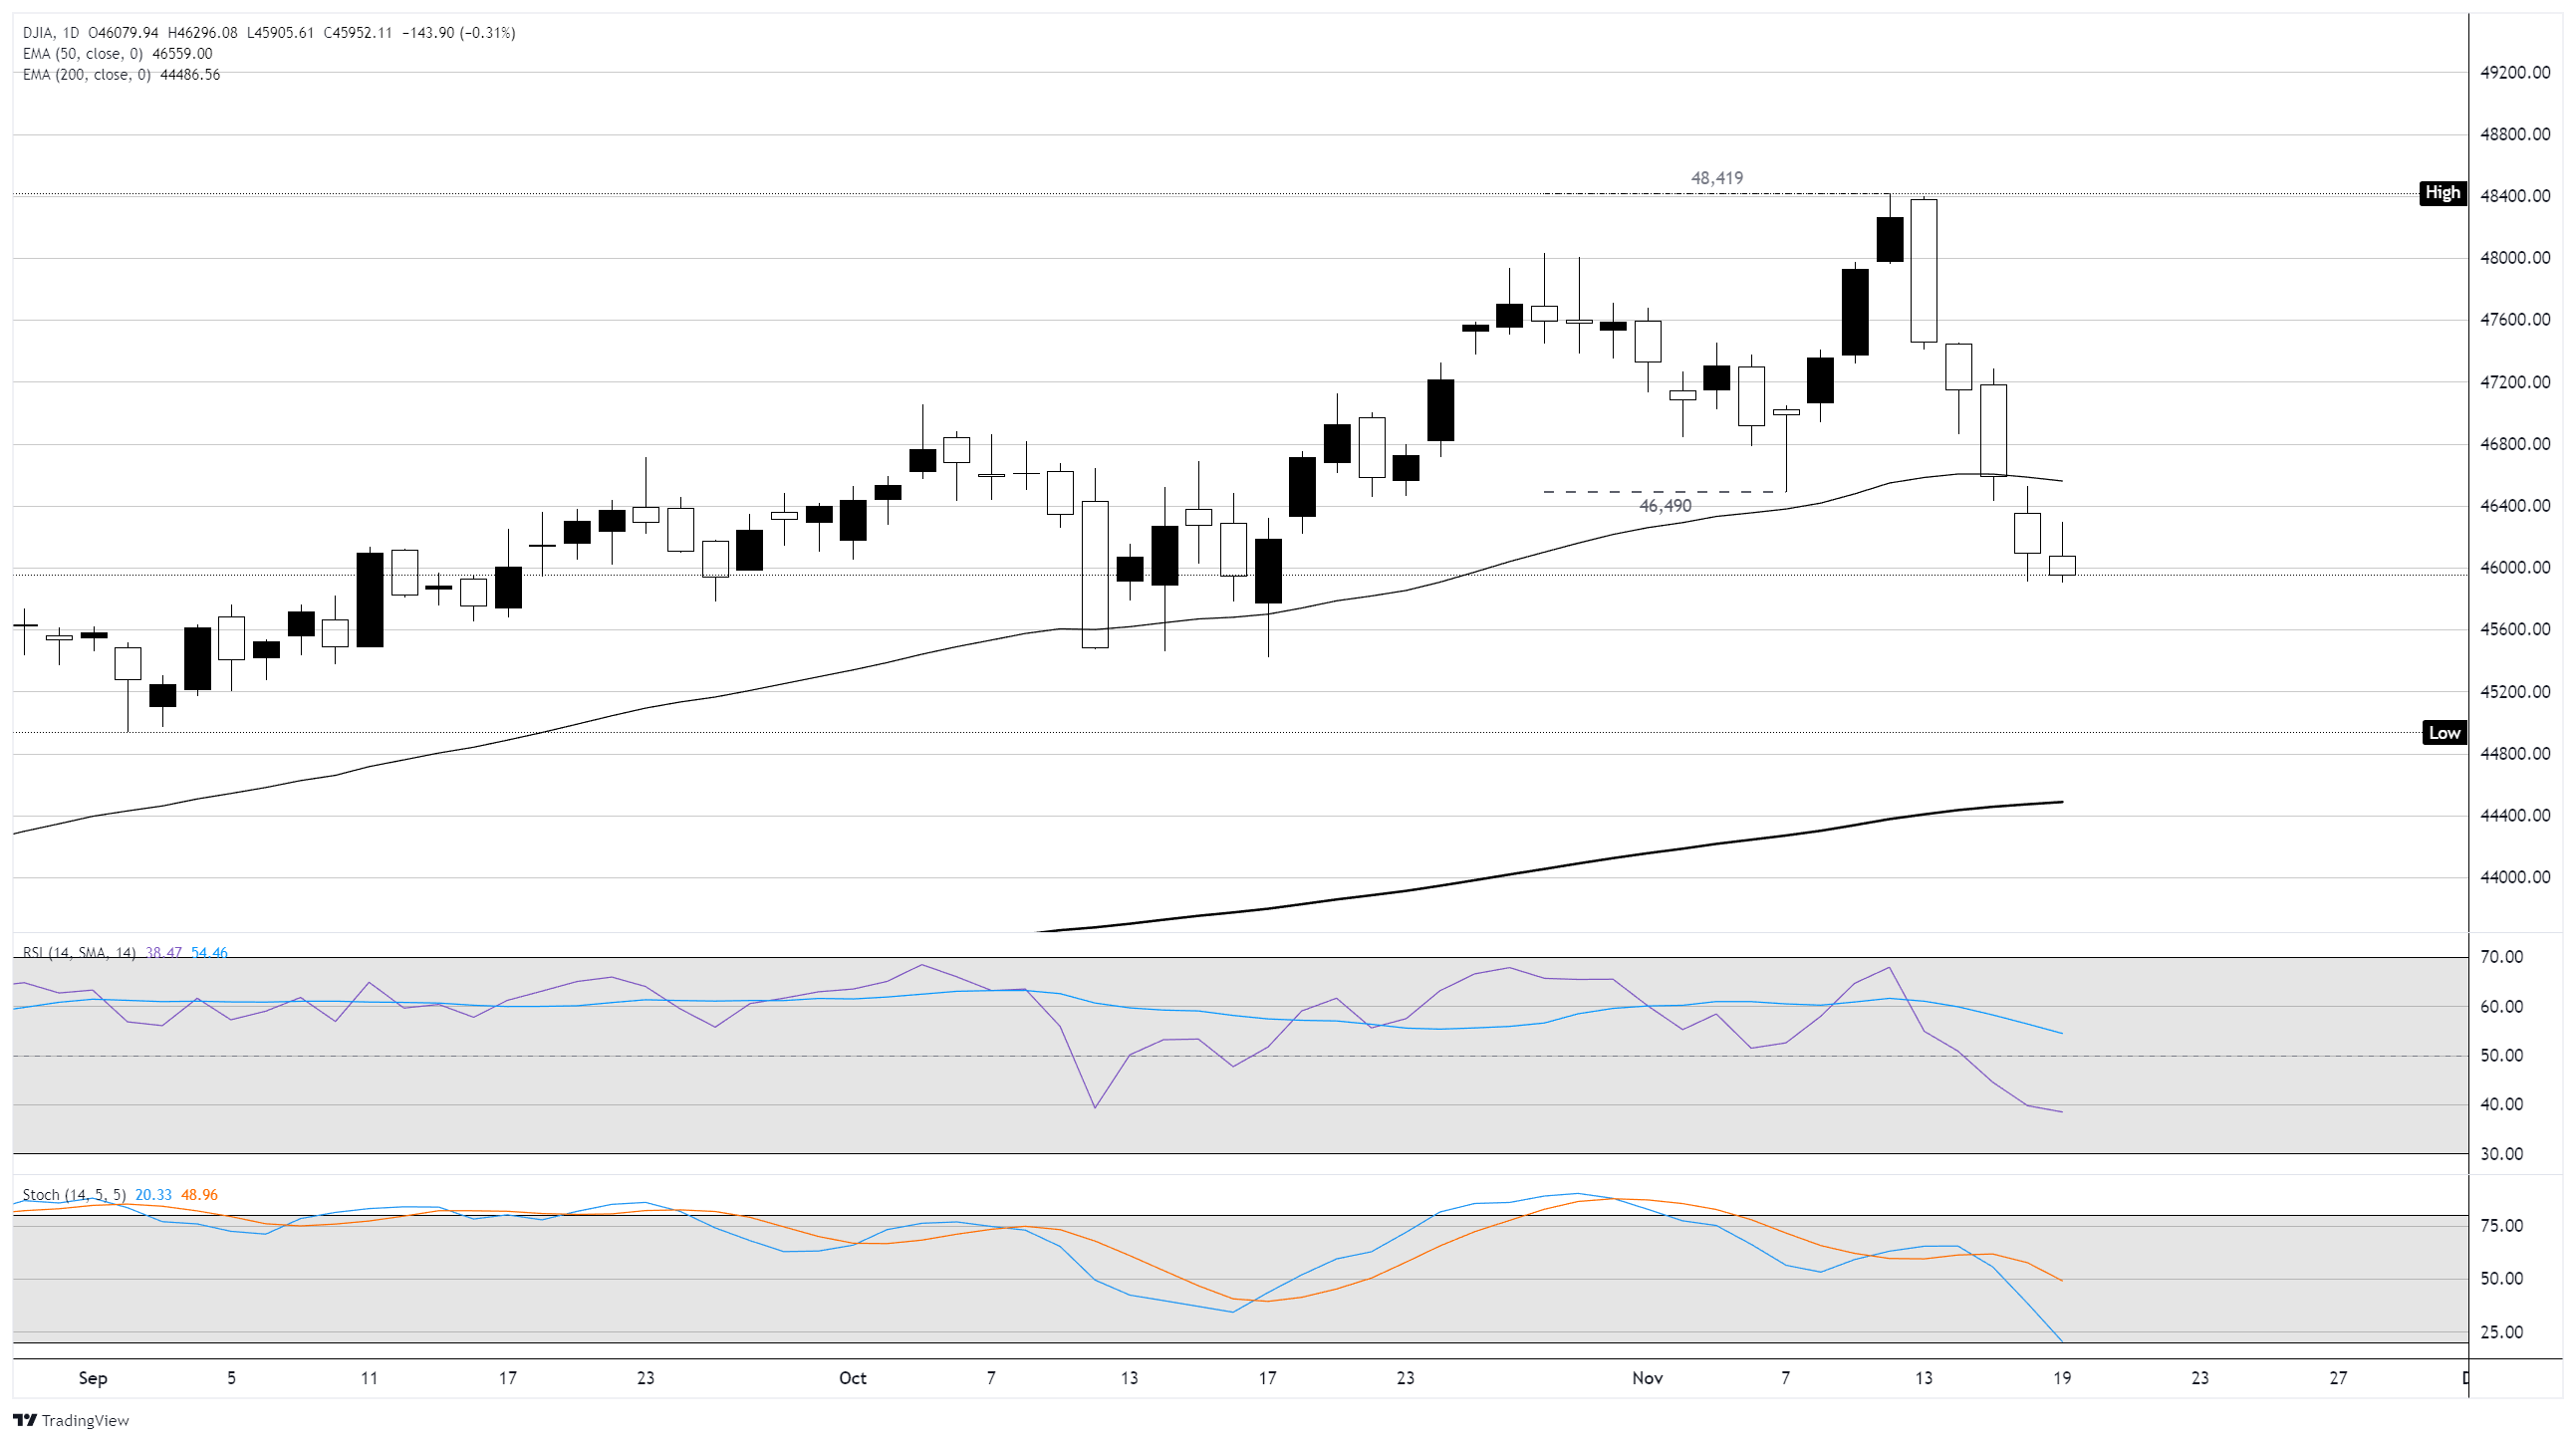
The Dow Jones Industrial Average (DJIA) struggled to hold next to flat on Wednesday, mired in a downside trajectory near the 46,000 major price handle. The Dow Jones fell for four straight trading sessions, falling nearly 5% from a record high set near 48,420, but selling pressure in key average stocks may have run too far, too fast.
Nvidia earnings due after the closing bell
Nvidia (NVDA) has a key earnings report releasing after markets close on Wednesday, and the AI darling chipset printer has a high bar to pass. Nvidia is down over 12% through November as investors begin to question when returns are expected on trillions of dollars in capex and investment commitments in the increasingly circular AI tech segment.
Nvidia’s stock price has become a bellwether for the overall health of the LLM craze. As the premier shovel-seller in the AI gold rush, Nvidia is overwhelmingly likely to continue posting record-breaking growth metrics, but Wall Street expectations for the silicon-puncher’s earnings have run into the stratosphere.
The US Bureau of Labor Statistics has pre-emptively canceled the release of October’s Nonfarm Payrolls (NFP) report, citing a lack of data collection through the federal government shutdown. Rate markets are already recoiling, pricing down the odds of a December cut. According to the CME’s FedWatch Tool, the odds of a Federal Reserve (Fed) interest rate cut on December 10 have fallen to around 30%.
FOMC seemed willing to explore a December cut
The Federal Open Market Committee’s (FOMC) latest Meeting Minutes showed that several Fed policymakers were open to the idea of a December rate cut, but those observations were made before Fed officials knew the October NFP data would be deleted from history.
September’s NFP jobs report will be published on Thursday. However, the report is already unlikely to drive much market attention now that an October lull will leave policymakers in a data lurch until the new year.
Dow Jones daily chart
Dow Jones FAQs
The Dow Jones Industrial Average, one of the oldest stock market indices in the world, is compiled of the 30 most traded stocks in the US. The index is price-weighted rather than weighted by capitalization. It is calculated by summing the prices of the constituent stocks and dividing them by a factor, currently 0.152. The index was founded by Charles Dow, who also founded the Wall Street Journal. In later years it has been criticized for not being broadly representative enough because it only tracks 30 conglomerates, unlike broader indices such as the S&P 500.
Many different factors drive the Dow Jones Industrial Average (DJIA). The aggregate performance of the component companies revealed in quarterly company earnings reports is the main one. US and global macroeconomic data also contributes as it impacts on investor sentiment. The level of interest rates, set by the Federal Reserve (Fed), also influences the DJIA as it affects the cost of credit, on which many corporations are heavily reliant. Therefore, inflation can be a major driver as well as other metrics which impact the Fed decisions.
Dow Theory is a method for identifying the primary trend of the stock market developed by Charles Dow. A key step is to compare the direction of the Dow Jones Industrial Average (DJIA) and the Dow Jones Transportation Average (DJTA) and only follow trends where both are moving in the same direction. Volume is a confirmatory criteria. The theory uses elements of peak and trough analysis. Dow’s theory posits three trend phases: accumulation, when smart money starts buying or selling; public participation, when the wider public joins in; and distribution, when the smart money exits.
There are a number of ways to trade the DJIA. One is to use ETFs which allow investors to trade the DJIA as a single security, rather than having to buy shares in all 30 constituent companies. A leading example is the SPDR Dow Jones Industrial Average ETF (DIA). DJIA futures contracts enable traders to speculate on the future value of the index and Options provide the right, but not the obligation, to buy or sell the index at a predetermined price in the future. Mutual funds enable investors to buy a share of a diversified portfolio of DJIA stocks thus providing exposure to the overall index.
추천 기사


