Crude Oil markets jitter as US-Russia sanctions debacle heats up
- WTI prices saw volatile moves on Tuesday as US sanction threats against Russia ramp up.
- The Trump administration is trying to squeeze a ceasefire out of Russia via Crude Oil sanctions.
- Donald Trump has already threatened sky-high tariffs on India for continuing to deal in Russian fossil fuels.
West Texas Intermediate (WTI) Crude Oil prices snapped back and forth during the American market session on Tuesday, before ultimately settling lower as barrel traders struggle to find reasons to remain bullish on Crude Oil demand. The Trump administration is ramping up its sanction rhetoric against Russia, which thus far has stubbornly avoided reaching a ceasefire agreement with Ukraine. Resolving the ongoing Russian invasion of Ukraine was a linchpin campaign promise by President Donald Trump, who has reportedly grown impatient with Russian President Vladimir Putin who keeps finding excuses to not follow through on any meaningful ceasefire negotiations over the last seven months.
Trump poised to add more sanctions over lack of ceasefire
According to early market rumors that circulated on Tuesday, Russia may be considering offering a temporary truce to Ukraine that would ostensibly remain limited to air-to-surface attacks by either side. Russia’s efforts to defend against an onslaught of Ukrainian attacks via drone have been poorly executed, flummoxing Russian defense initiatives and hampering efforts to continue invading the European country on the ground.
The Financial Times also reported on Tuesday that the Trump administration is poised to impose a fresh batch of trade sanctions against Russia, with a focus on Russia’s “shadow fleet” of exporting ships that are being used to circumvent existing US sanctions. Combining the two items shows how far apart the US and Russia may be when it comes to settling the “three-day” Ukrainian invasion that has stretched out to 1,258 days and counting. According to the Financial Times, President Trump wants a ceasefire on the table by Friday or the Russian government will have to face down further trade sanctions.
President Trump threatened earlier this week to impose stiff import tariffs on all Indian goods bound for the US if the Indian government continues to trade in Russian Crude Oil products. India, a major importer of Russian fossil fuel products, is both a major consumer and reseller of Russian energy, acting as a clearing hub for European-Baltic barrel trade.
WTI price forecast
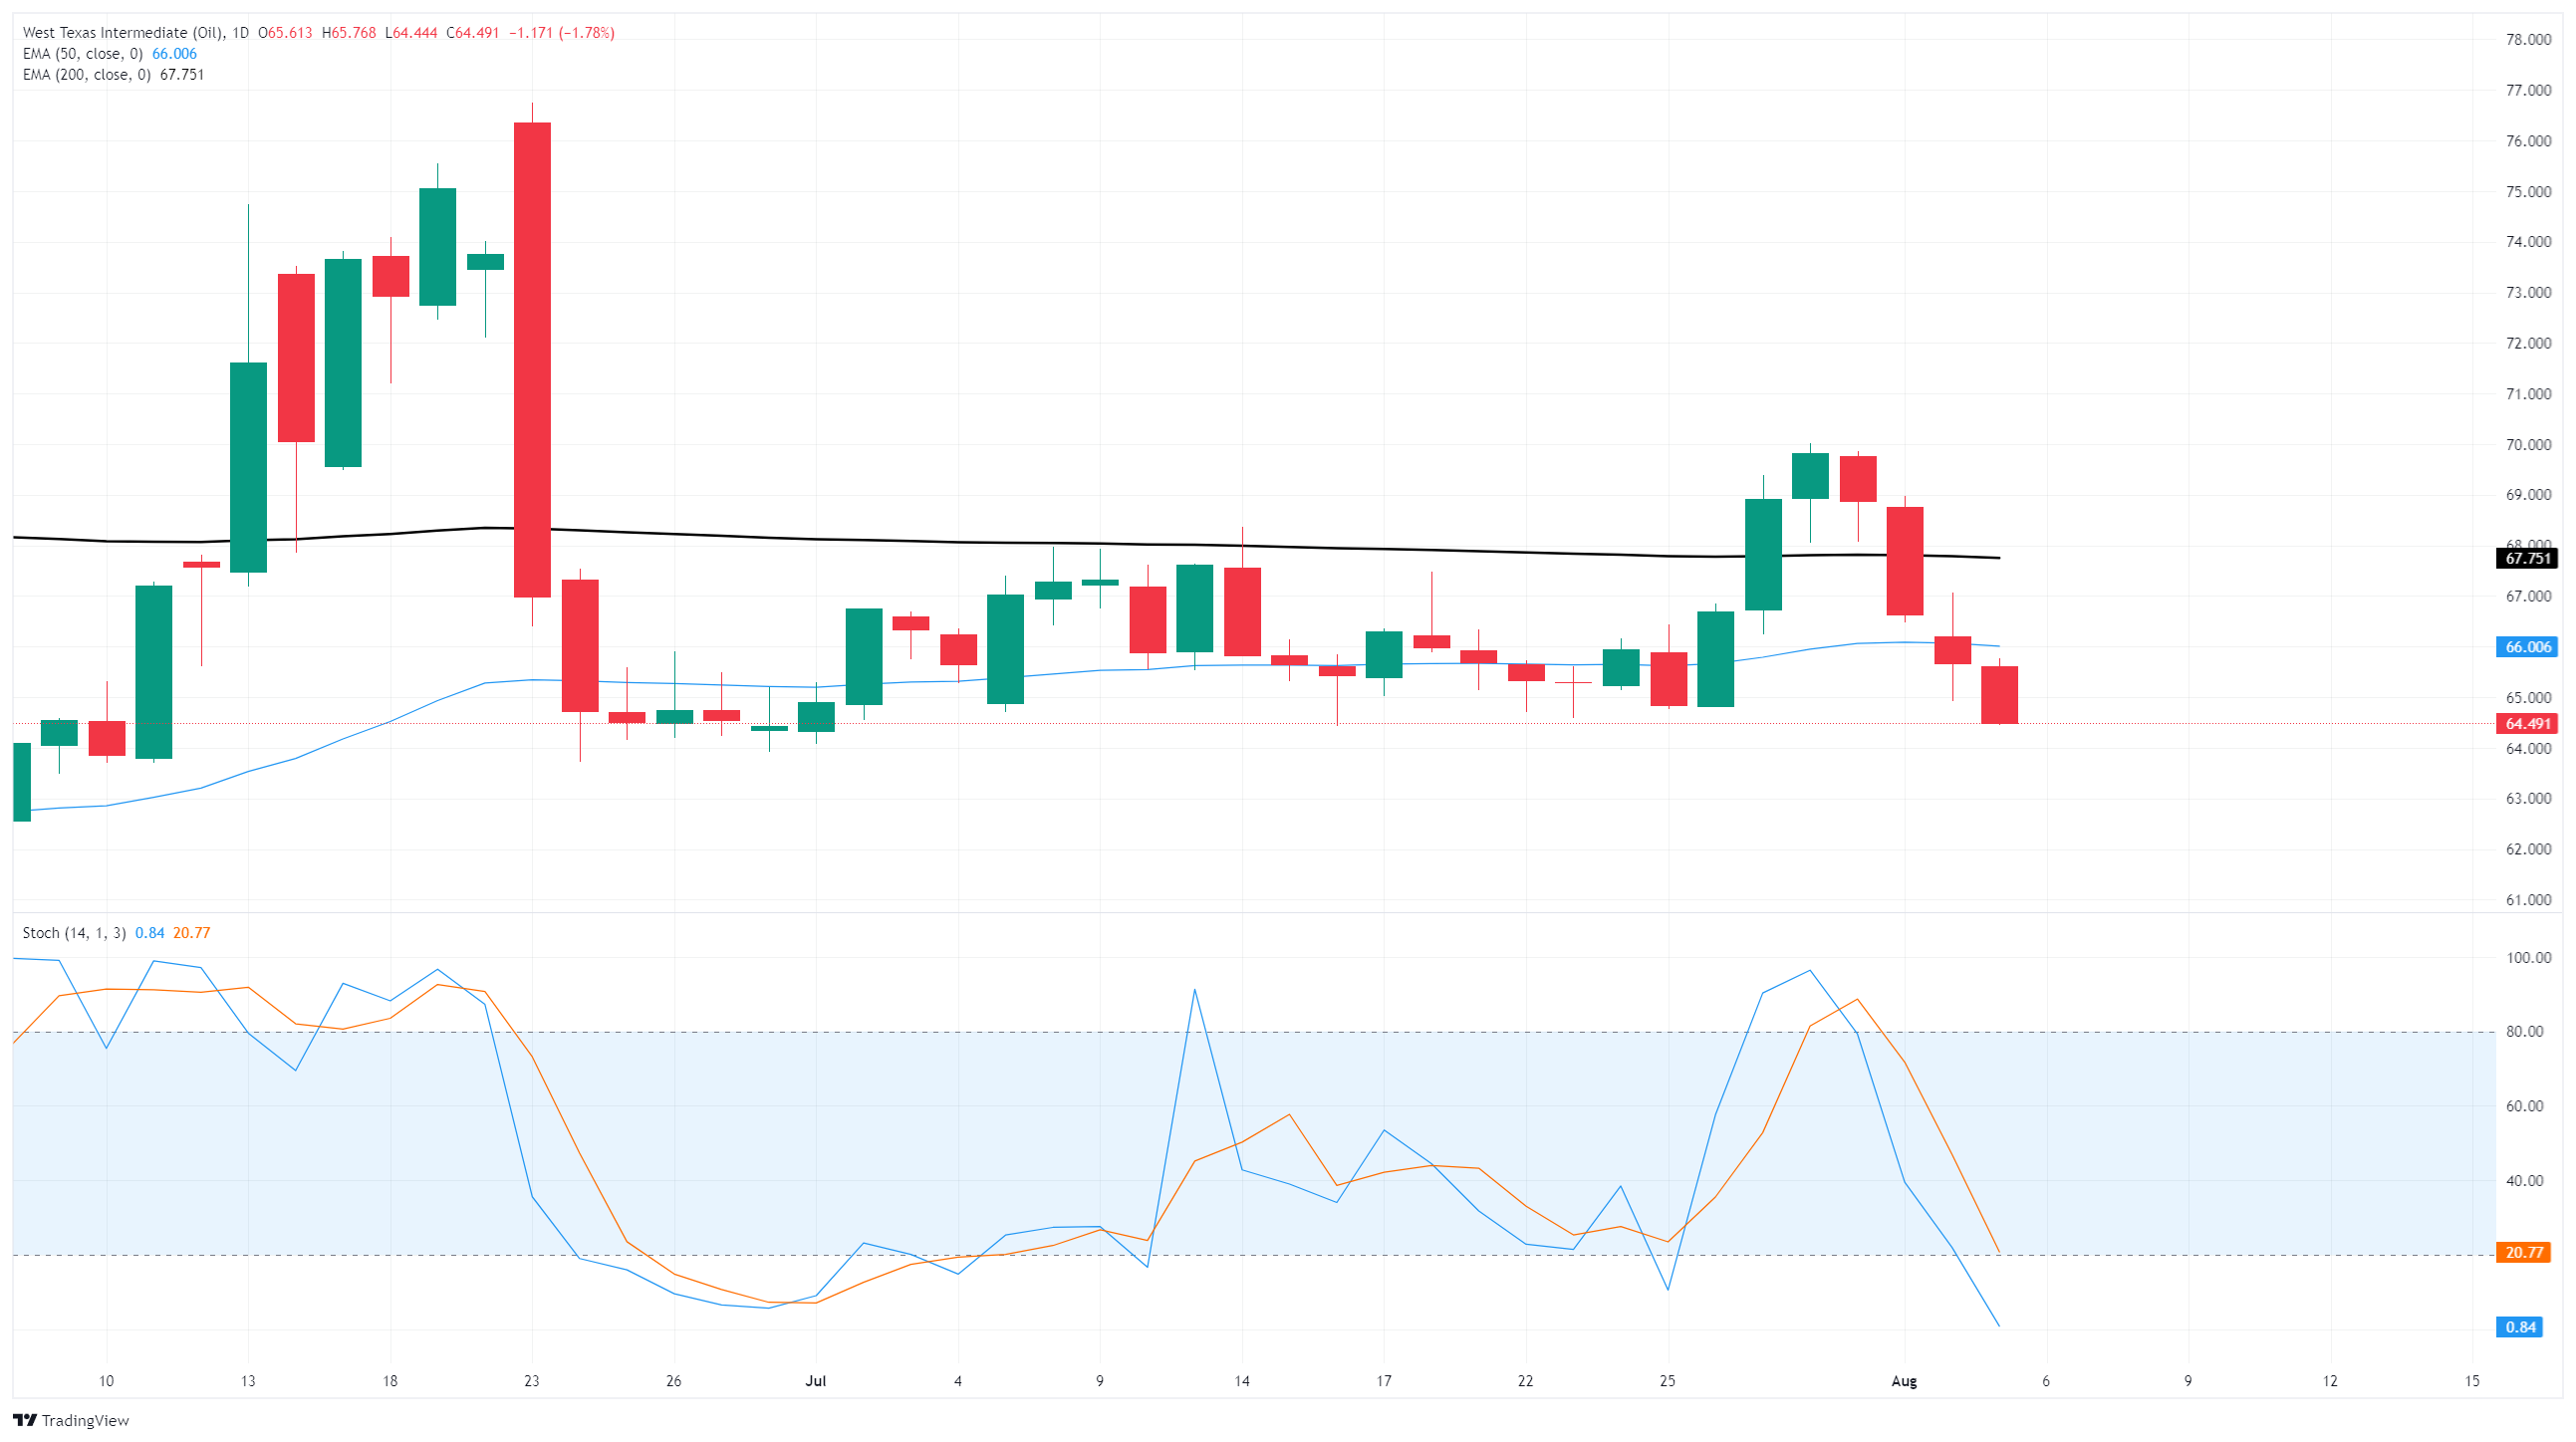
Bullish momentum has evaporated out of the WTI charts, with US Crude Oil barrels struggling to find a foothold after backsliding nearly 8% top-to-bottom from late July’s peak just above $70.00 per barrel. WTI has tumbled back below $64.50, accelerating a near-term decline as US barrel bids chalk in a fourth straight daily decline.
WTI daily chart

WTI Oil FAQs
WTI Oil is a type of Crude Oil sold on international markets. The WTI stands for West Texas Intermediate, one of three major types including Brent and Dubai Crude. WTI is also referred to as “light” and “sweet” because of its relatively low gravity and sulfur content respectively. It is considered a high quality Oil that is easily refined. It is sourced in the United States and distributed via the Cushing hub, which is considered “The Pipeline Crossroads of the World”. It is a benchmark for the Oil market and WTI price is frequently quoted in the media.
Like all assets, supply and demand are the key drivers of WTI Oil price. As such, global growth can be a driver of increased demand and vice versa for weak global growth. Political instability, wars, and sanctions can disrupt supply and impact prices. The decisions of OPEC, a group of major Oil-producing countries, is another key driver of price. The value of the US Dollar influences the price of WTI Crude Oil, since Oil is predominantly traded in US Dollars, thus a weaker US Dollar can make Oil more affordable and vice versa.
The weekly Oil inventory reports published by the American Petroleum Institute (API) and the Energy Information Agency (EIA) impact the price of WTI Oil. Changes in inventories reflect fluctuating supply and demand. If the data shows a drop in inventories it can indicate increased demand, pushing up Oil price. Higher inventories can reflect increased supply, pushing down prices. API’s report is published every Tuesday and EIA’s the day after. Their results are usually similar, falling within 1% of each other 75% of the time. The EIA data is considered more reliable, since it is a government agency.
OPEC (Organization of the Petroleum Exporting Countries) is a group of 12 Oil-producing nations who collectively decide production quotas for member countries at twice-yearly meetings. Their decisions often impact WTI Oil prices. When OPEC decides to lower quotas, it can tighten supply, pushing up Oil prices. When OPEC increases production, it has the opposite effect. OPEC+ refers to an expanded group that includes ten extra non-OPEC members, the most notable of which is Russia.


