
NZD/USD rises as markets brace for New Zealand CPI and weigh potential Fed dovish tilt
- NZD/USD rebounds toward clustered resistance as New Zealand CPI looms.
- New Zealand inflation is expected to set the tone for the cautious RBNZ while dovish Fed Waller increases expectations of a September rate cut.
- NZD/USD approaches moving average resistance with price action vulnerable to upcoming CPI.
The New Zealand Dollar (NZD) is strengthening against the US Dollar (USD) on Friday as investors reposition expectations of US interest rates and look ahead to New Zealand's upcoming inflation data.
At the time of writing, NZD/USD is trading near 0.5960 with intraday gains of 0.50%.
New Zealand inflation is expected to set the tone for the cautious RBNZ while dovish Fed Waller increases expectations of a September rate cut
On Sunday evening (22:45 GMT) Statistics New Zealand will release the Consumer Price Index (CPI) data for the second quarter. Expectations for Q2 CPI arrive at 0.6% QoQ from 0.9%, with the annual estimate for Q2 at 2.8%, which would reflect an increase from the prior 2.5% reading.
As New Zealand’s inflation data is a key input into Reserve Bank of New Zealand (RBNZ) policy decisions, any upside surprise could revive expectations that the RBNZ will hold rates at the current 3.25% level for longer.
Quotes from the July RBNZ meeting released in the media report showed that the board members remained cautious, stating that, “The economic outlook remains highly uncertain. Further data on the speed of New Zealand’s economic recovery, the persistence of inflation, and the impacts of tariffs will influence the future path of the Official Cash Rate.”
In broader FX markets, the US Dollar weakened on Friday after Federal Reserve (Fed) Governor Christopher Waller continued to advocate for the Fed to cut rates at the July meeting if inflation continues to ease. His dovish tilt sparked a repricing of Fed expectations and increased the likelihood of a rate cut in September, with another one priced in for later in the year.
This triggered a pullback in the USD, providing some near-term relief for risk-sensitive currencies like NZD. However, with broader risk appetite still fragile and key data ahead, traders are likely to watch both USD sentiment and technical levels for directional cues.
NZD/USD approaches moving average resistance with price action vulnerable to upcoming CPI.
On the daily chart, NZD/USD has rebounded off a key support zone near the June low of 0.5883 and the 100-day Simple Moving Average (SMA) at 0.5897, establishing a temporary floor after the recent sell-off.
The pair has reclaimed the 38.2% Fibonacci retracement level of the May low-July high move at 0.5951 with a bullish daily candle reflecting renewed buying interest.
However, the recovery now faces significant resistance overhead, including the 50% retracement at 0.5984, the 50-day SMA at 0.5994, and the 61.8% Fibonacci level of 0.6016, in close proximity to the 20-day SMA at 0.6018.
This has created a dense technical barrier likely to cap gains unless fueled by a fundamental catalyst such as stronger-than-expected CPI data or continued US Dollar weakness.
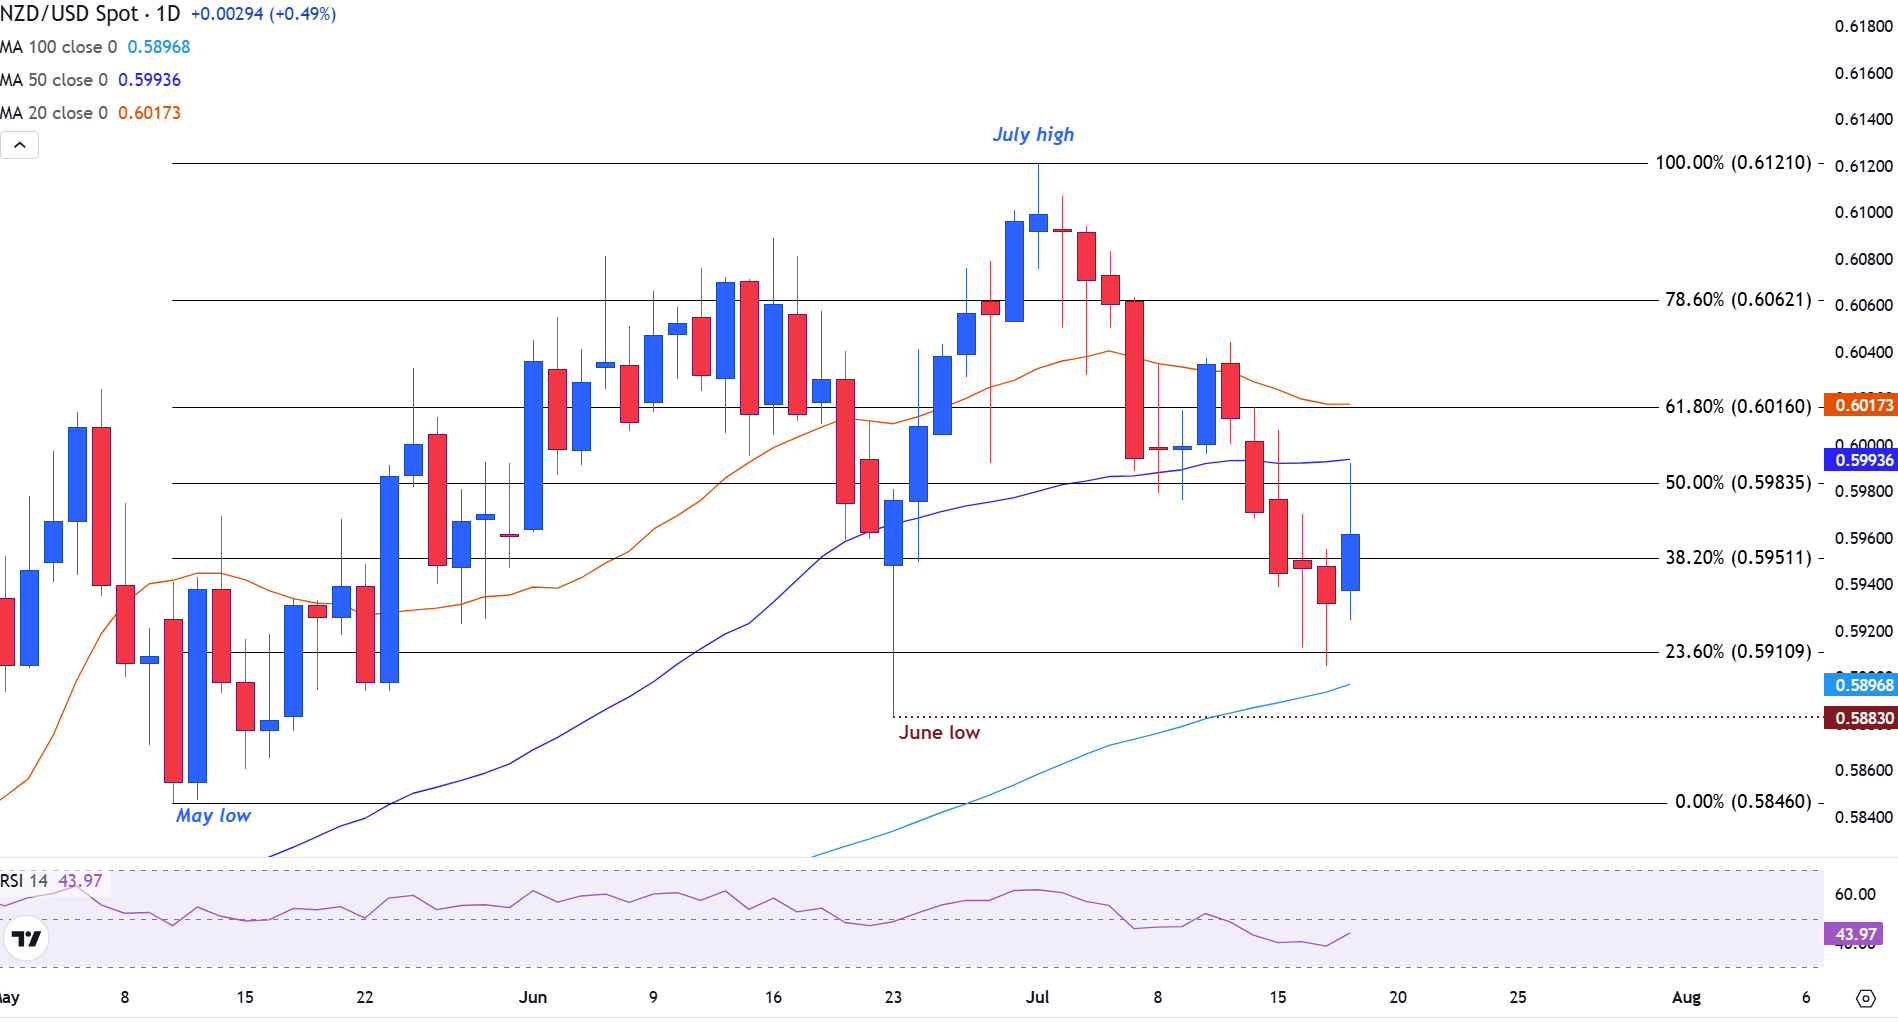
NZD/USD daily chart
The Relative Strength Index (RSI) sits at 45, recovering from oversold conditions but still neutral, supporting the idea of a short-term bounce without confirming a full trend reversal.
A breakout above 0.5985–0.6017 would invalidate the recent bearish structure and expose the 78.6% retracement at 0.60621, with scope for a move toward the July high near 0.61210. On the downside, failure to hold above 0.5951 could see bearish momentum resume, targeting 0.5910 and the June low at 0.5883, especially if New Zealand’s inflation data underwhelms or the US Dollar regains strength following Fed commentary.
Inflation FAQs
Inflation measures the rise in the price of a representative basket of goods and services. Headline inflation is usually expressed as a percentage change on a month-on-month (MoM) and year-on-year (YoY) basis. Core inflation excludes more volatile elements such as food and fuel which can fluctuate because of geopolitical and seasonal factors. Core inflation is the figure economists focus on and is the level targeted by central banks, which are mandated to keep inflation at a manageable level, usually around 2%.
The Consumer Price Index (CPI) measures the change in prices of a basket of goods and services over a period of time. It is usually expressed as a percentage change on a month-on-month (MoM) and year-on-year (YoY) basis. Core CPI is the figure targeted by central banks as it excludes volatile food and fuel inputs. When Core CPI rises above 2% it usually results in higher interest rates and vice versa when it falls below 2%. Since higher interest rates are positive for a currency, higher inflation usually results in a stronger currency. The opposite is true when inflation falls.
Although it may seem counter-intuitive, high inflation in a country pushes up the value of its currency and vice versa for lower inflation. This is because the central bank will normally raise interest rates to combat the higher inflation, which attract more global capital inflows from investors looking for a lucrative place to park their money.
Formerly, Gold was the asset investors turned to in times of high inflation because it preserved its value, and whilst investors will often still buy Gold for its safe-haven properties in times of extreme market turmoil, this is not the case most of the time. This is because when inflation is high, central banks will put up interest rates to combat it. Higher interest rates are negative for Gold because they increase the opportunity-cost of holding Gold vis-a-vis an interest-bearing asset or placing the money in a cash deposit account. On the flipside, lower inflation tends to be positive for Gold as it brings interest rates down, making the bright metal a more viable investment alternative.
추천 기사


