
USD/JPY Price Forecast: Eyes breakout as triangle narrows, but lacks momentum
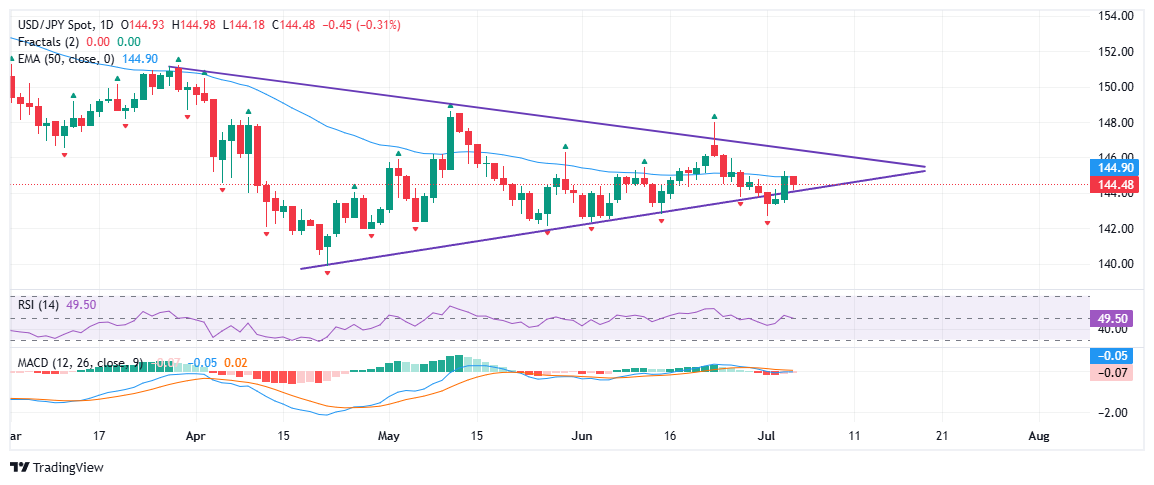
- The USD/JPY trades near 144.50 on Friday, amid thin liquidity, as US markets remain closed for Independence Day.
- Weekly candle shaping up as a long-legged doji, signaling strong indecision and potential breakout.
- The 50-day EMA at 144.90 acts as immediate resistance, while Initial support rests at Thursday's low near 143.50.
The US Dollar (USD) is trading slightly lower against the Japanese Yen (JPY) on Friday, with the USD/JPY hovering around 144.50 in subdued holiday-thinned conditions as US markets remain closed for Independence Day.
Despite the intraday dip, USD/JPY remains comfortably above the lower boundary of a symmetrical triangle on the daily chart, marked by lower highs and higher lows since April. This suggests a slightly positive outlook ahead of the weekly close, particularly with the weekly candle forming a long-legged doji, indicating the ongoing tug-of-war between bulls and bears.
The symmetrical triangle pattern suggests that while neither bulls nor bears have taken firm control, as price approaches the triangle’s apex. The 50-day Exponential Moving Average (EMA), currently hovering around 144.90, acts as immediate resistance. A clear break above this confluence zone could pave the way for a bullish move toward the upper boundary of the triangle, the 146.50–147.00 region.
On the downside, initial support lies near Thursday's low of 143.50, which closely aligns with the ascending trendline forming the base of the triangle. A daily close below this level would tilt the short-term bias in favor of sellers, potentially paving the way for a decline toward the 142.50 level marked on July 1, followed by the April swing low near 139.89.
From a momentum perspective, the Relative Strength Index (RSI) on the daily chart is hovering near 49, indicating a balanced market. However, the RSI is showing a mild downward slope, suggesting fading bullish momentum and light selling pressure as the pair drifts lower within the previous day's range.
Meanwhile, the Moving Average Convergence Divergence (MACD) remains flat and lacks direction. The MACD line is marginally below the signal line, and the histogram continues to narrow, reflecting subdued momentum. This reinforces the view that traders are staying cautious and awaiting a clear catalyst before placing fresh bets.
Japanese Yen FAQs
The Japanese Yen (JPY) is one of the world’s most traded currencies. Its value is broadly determined by the performance of the Japanese economy, but more specifically by the Bank of Japan’s policy, the differential between Japanese and US bond yields, or risk sentiment among traders, among other factors.
One of the Bank of Japan’s mandates is currency control, so its moves are key for the Yen. The BoJ has directly intervened in currency markets sometimes, generally to lower the value of the Yen, although it refrains from doing it often due to political concerns of its main trading partners. The BoJ ultra-loose monetary policy between 2013 and 2024 caused the Yen to depreciate against its main currency peers due to an increasing policy divergence between the Bank of Japan and other main central banks. More recently, the gradually unwinding of this ultra-loose policy has given some support to the Yen.
Over the last decade, the BoJ’s stance of sticking to ultra-loose monetary policy has led to a widening policy divergence with other central banks, particularly with the US Federal Reserve. This supported a widening of the differential between the 10-year US and Japanese bonds, which favored the US Dollar against the Japanese Yen. The BoJ decision in 2024 to gradually abandon the ultra-loose policy, coupled with interest-rate cuts in other major central banks, is narrowing this differential.
The Japanese Yen is often seen as a safe-haven investment. This means that in times of market stress, investors are more likely to put their money in the Japanese currency due to its supposed reliability and stability. Turbulent times are likely to strengthen the Yen’s value against other currencies seen as more risky to invest in.
추천 기사


