


USD/CHF Price Forecast: Posts weekly loss, despite Friday rebound to 0.8100
- USD/CHF closes Friday up 0.04%, but logs 1.37% weekly drop to 1-month low at 0.8054.
- Bearish structure persists: lower highs/lows and weak RSI signal continued downside momentum.
- Key support lies at 0.8054 and 0.8038; breach may expose psychological 0.8000 level.
- Bulls need a break above 0.8147 to challenge 0.8200 and the 50-day SMA near 0.8257.
The USD/CHF ended Friday’s session with gains of over 0.04%, but in the week fell over 1.37% to a one-month low of 0.8054. At the time of writing, the pair trades at 0.8104 due to increased demand for the Dollar amid risk aversion.
USD/CHF Price Forecast: Technical outlook
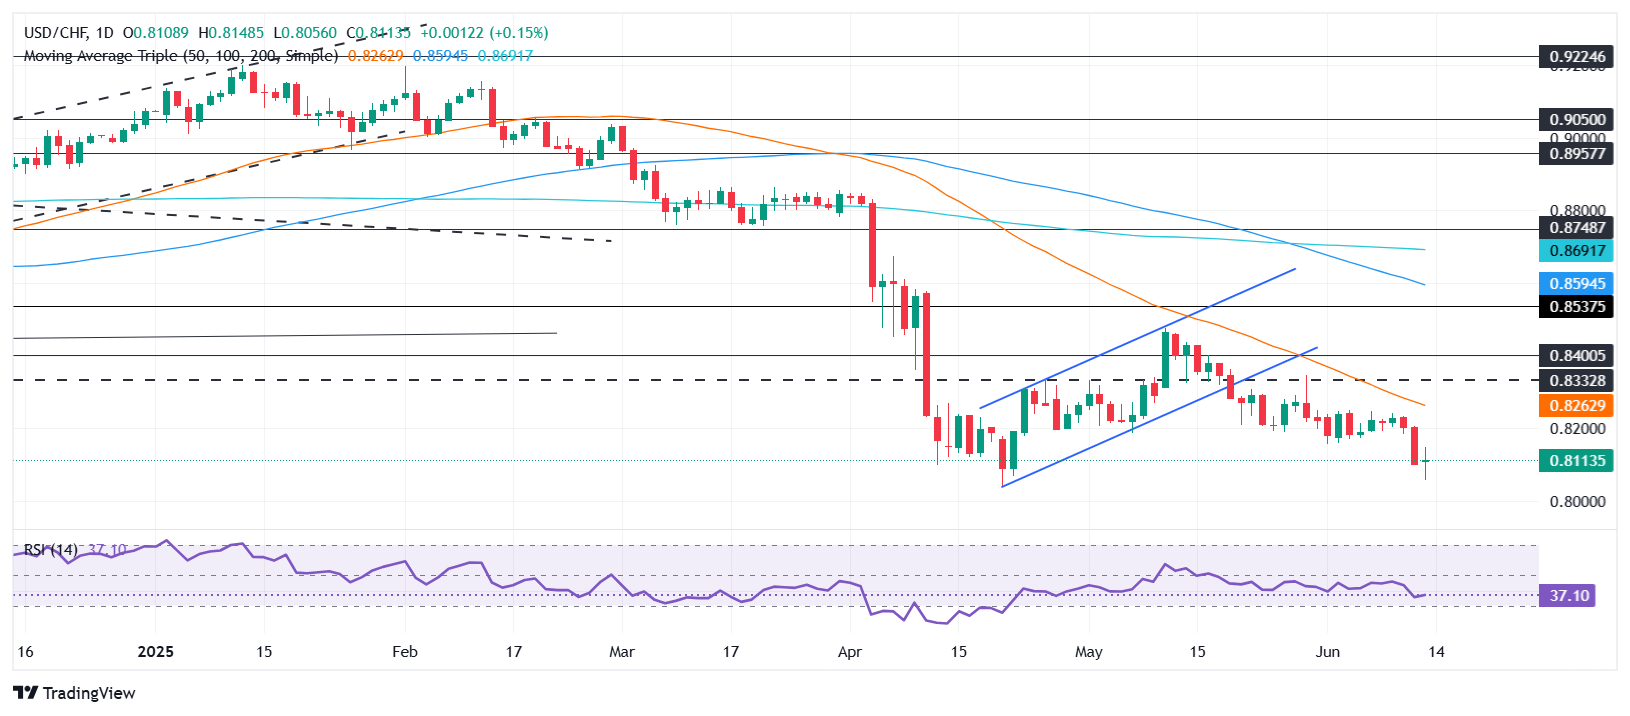
The USD/CHF is bearishly biased due to its price action pattern of successively lower highs and lower lows, indicating that sellers are in control. Additionally, the Relative Strength Index (RSI) registered a lower low, indicating bearish territory. That said, the path of least resistance is tilted to the downside.
If the USD/CHF drops below 0.8100, the next support level would be the June 13 low of 0.8054. On further weakness, the pair fall could extend to 0.8038, ahead of the 0.8000 figure.
On the upside, a decisive break of the June 13 high of 0.8147 can open the door to test 0.82, followed by the 50-day Simple Moving Average (SMA) at 0.8057.
USD/CHF Price Chart – Daily
Swiss Franc PRICE This week
The table below shows the percentage change of Swiss Franc (CHF) against listed major currencies this week. Swiss Franc was the strongest against the Australian Dollar.
| USD | EUR | GBP | JPY | CAD | AUD | NZD | CHF | |
|---|---|---|---|---|---|---|---|---|
| USD | -1.33% | -0.29% | -0.52% | -0.82% | 0.15% | 0.09% | -1.29% | |
| EUR | 1.33% | 1.00% | 0.82% | 0.51% | 1.53% | 1.36% | 0.04% | |
| GBP | 0.29% | -1.00% | -0.10% | -0.49% | 0.53% | 0.38% | -0.91% | |
| JPY | 0.52% | -0.82% | 0.10% | -0.30% | 0.63% | 0.50% | -0.84% | |
| CAD | 0.82% | -0.51% | 0.49% | 0.30% | 0.86% | 0.84% | -0.46% | |
| AUD | -0.15% | -1.53% | -0.53% | -0.63% | -0.86% | -0.18% | -1.43% | |
| NZD | -0.09% | -1.36% | -0.38% | -0.50% | -0.84% | 0.18% | -1.24% | |
| CHF | 1.29% | -0.04% | 0.91% | 0.84% | 0.46% | 1.43% | 1.24% |
The heat map shows percentage changes of major currencies against each other. The base currency is picked from the left column, while the quote currency is picked from the top row. For example, if you pick the Swiss Franc from the left column and move along the horizontal line to the US Dollar, the percentage change displayed in the box will represent CHF (base)/USD (quote).
추천 기사


