
EUR/USD Price Forecast: Tests descending channel’s upper boundary near 1.1250
- EUR/USD is testing the upper boundary of its descending channel near the 1.1250 level.
- Technical analysis suggests a bearish bias is active, as the pair remains within the confines of the downward channel.
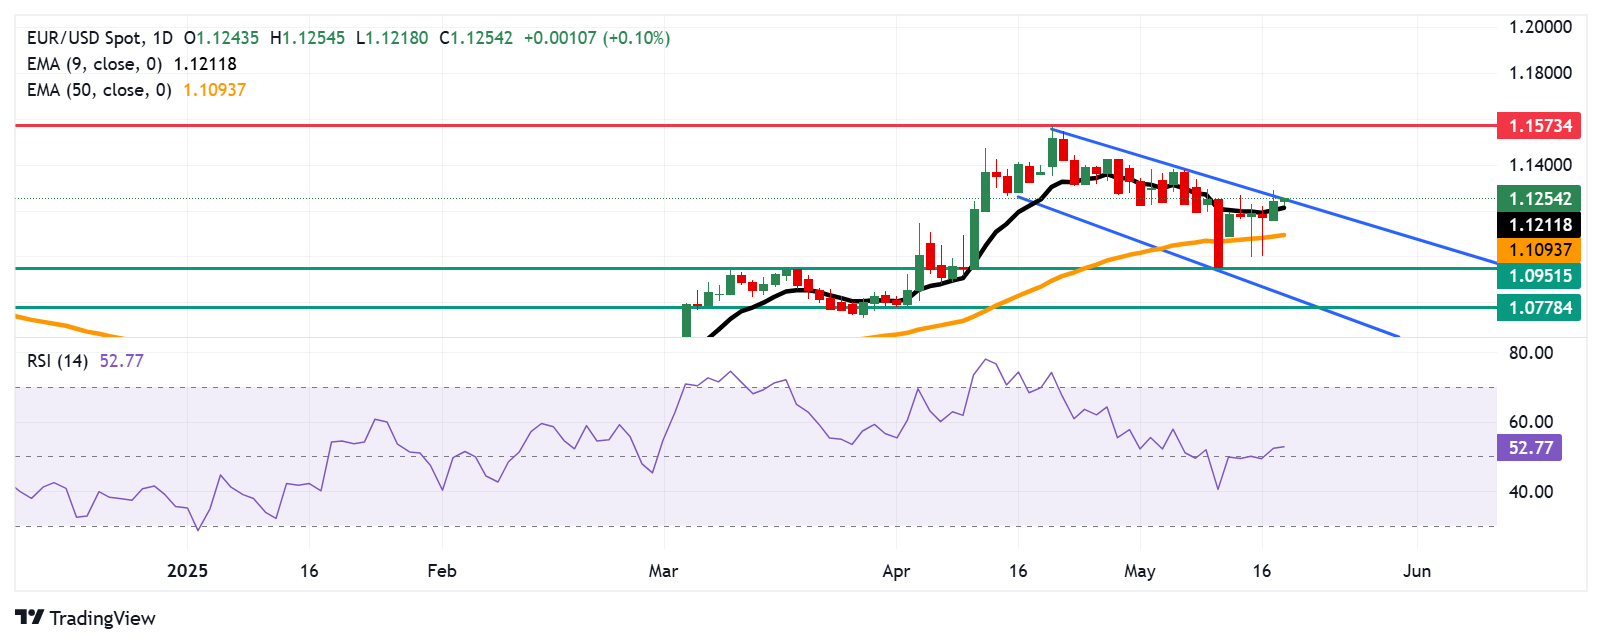
- Initial support is seen around the nine-day EMA at 1.1210, followed by stronger support near the 50-day EMA at 1.1093.
EUR/USD remains steady after registering more than 0.50% gains in the previous session, trading around 1.1240 during the Asian hours on Tuesday. On the daily chart, technical analysis indicates a bearish bias is in play, as the pair continues to trade lower within a descending channel pattern.
However, the EUR/USD pair has moved above the nine-day Exponential Moving Average (EMA), indicating strengthening short-term momentum. Additionally, the 14-day Relative Strength Index (RSI) remains slightly above the 50 level, reinforcing the potential for a bullish outlook.
The EUR/USD pair is likely to find initial support near the nine-day EMA at 1.1211, with additional support at the 50-day EMA around 1.1093. A decisive break below this level could undermine short- to medium-term bullish momentum, potentially driving the pair toward the six-week low at 1.0951 and the lower boundary of the descending channel near 1.0840. If bearish pressure persists, further support may emerge around the two-month low of 1.0778, last seen on April 1.
On the upside, the EUR/USD pair may challenge the upper boundary of the descending channel near 1.1250. A breakout above this level could strengthen the bullish bias and open the door for a move toward the April 21 high of 1.1573 — the pair’s highest level since November 2021.
EUR/USD: Daily Chart
Euro PRICE Today
The table below shows the percentage change of Euro (EUR) against listed major currencies today. Euro was the strongest against the Australian Dollar.
| USD | EUR | GBP | JPY | CAD | AUD | NZD | CHF | |
|---|---|---|---|---|---|---|---|---|
| USD | -0.11% | -0.14% | -0.23% | 0.02% | 0.32% | 0.03% | -0.16% | |
| EUR | 0.11% | -0.02% | -0.11% | 0.14% | 0.45% | 0.15% | -0.04% | |
| GBP | 0.14% | 0.02% | -0.10% | 0.15% | 0.44% | 0.19% | 0.02% | |
| JPY | 0.23% | 0.11% | 0.10% | 0.24% | 0.54% | 0.24% | 0.12% | |
| CAD | -0.02% | -0.14% | -0.15% | -0.24% | 0.31% | 0.00% | -0.14% | |
| AUD | -0.32% | -0.45% | -0.44% | -0.54% | -0.31% | -0.29% | -0.45% | |
| NZD | -0.03% | -0.15% | -0.19% | -0.24% | -0.01% | 0.29% | -0.15% | |
| CHF | 0.16% | 0.04% | -0.02% | -0.12% | 0.14% | 0.45% | 0.15% |
The heat map shows percentage changes of major currencies against each other. The base currency is picked from the left column, while the quote currency is picked from the top row. For example, if you pick the Euro from the left column and move along the horizontal line to the US Dollar, the percentage change displayed in the box will represent EUR (base)/USD (quote).
추천 기사


