EUR/CAD Price Analysis: Euro steadies near 1.5600 as bulls hold longer-term edge

출처 Fxstreet
  • EUR/CAD trades around the 1.5600 zone following a quiet Friday session post-Europe.
  • Bullish structure holds, though short-term momentum indicators remain mixed.
  • Long-term trend indicators favor upside while near-term resistance levels begin to cap price.

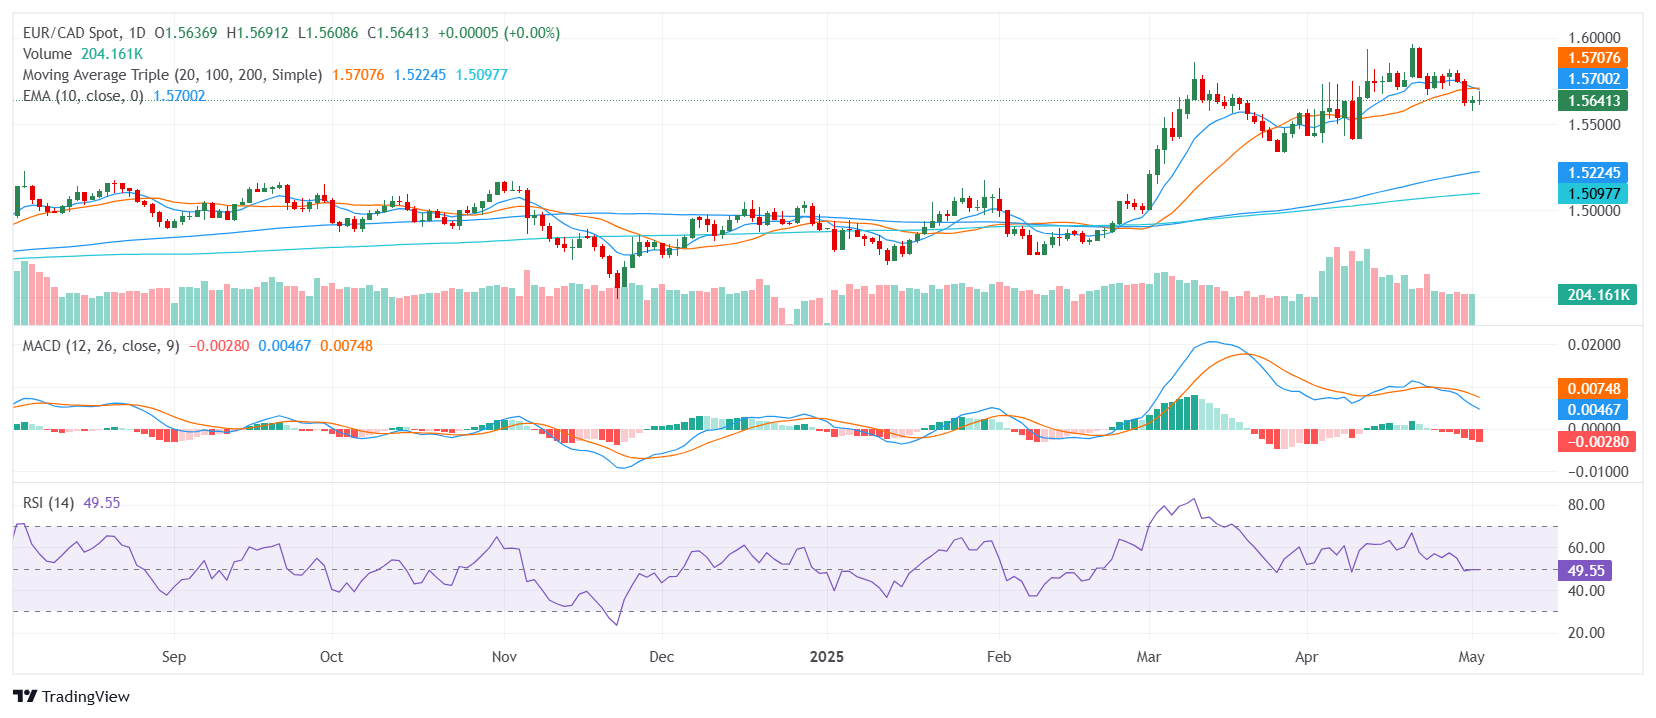
The EUR/CAD pair hovered near the 1.5600 zone on Friday after the European session, showing little change on the day but maintaining a steady bullish bias overall. Price action remains confined to the middle of the daily range, reflecting ongoing consolidation. While short-term signals show hesitation, the broader outlook is supported by strong trend-based indicators positioned below current levels.

From a technical standpoint, EUR/CAD retains a bullish posture, albeit with conflicting signals in the near term. The Relative Strength Index sits just below 50, marking a neutral momentum stance. The Moving Average Convergence Divergence sends a sell signal, pointing to a potential slowdown in upside drive. Meanwhile, the Stochastic %K and Commodity Channel Index are also neutral, underlining the current consolidation phase.

Trend indicators paint a clearer picture. The 30-day Exponential and Simple Moving Averages both lie just under current price action and maintain an upward slope. Though the 20-day Simple Moving Average stands above spot and signals selling pressure, it remains relatively flat and lacks confirmation from other tools. The longer-term 100-day and 200-day Simple Moving Averages continue to point upward, firmly supporting the pair’s medium-term bullish structure.

Support is seen at 1.5635, 1.5633, and 1.5627. Resistance levels stand at 1.5675, 1.5683, and 1.5686. A break above resistance could reinforce the bullish outlook, while failure to hold support may shift attention back toward the short-term moving averages.

Daily Chart
면책 조항: 정보 제공 목적으로만 사용됩니다. 과거 성과가 미래 결과를 보장하지 않습니다.
placeholder
올 한해 주목받은 팔란티어·아이온큐·앱플로빈, 2025년 전망은?Investing.com – 올 한해 한국 투자자들의 관심을 받은 종목은 테슬라와 엔비디아 (NASDAQ:NVDA) 같은 메가캡 기업뿐만 아니라 다양한 기업들이 포함되어 있다. 그중에서도 특히 많은 주목을 받은 팔란티어, 아이온큐, 앱플로빈의 2025년 전망에 대해 살펴보고자 한다. 특히, 아이온큐와 팔란티어는 12월 12일 기준 한국예탁결제원 보유금액 순
저자  Investing
2024 년 12 월 16 일
Investing.com – 올 한해 한국 투자자들의 관심을 받은 종목은 테슬라와 엔비디아 (NASDAQ:NVDA) 같은 메가캡 기업뿐만 아니라 다양한 기업들이 포함되어 있다. 그중에서도 특히 많은 주목을 받은 팔란티어, 아이온큐, 앱플로빈의 2025년 전망에 대해 살펴보고자 한다. 특히, 아이온큐와 팔란티어는 12월 12일 기준 한국예탁결제원 보유금액 순
placeholder
2025년 주목할 나스닥 100 저평가 기술주 3Investing.com – 수요일 (현지시각) 연준(Fed)의 금리 발표를 앞두고 어제 각종 주요 지수들은 숨고르기에 들어갔다. 2024년 올 한해 각종 주요 지수들은 신고가를 경신하며 상승세를 이어가고 있다. 올해 초 16,300대였던 기술주 중심의 나스닥 100 지수는 현재 22,000대로 무려 34% 이상 상승하였다.나스닥 100은 S&P 500과
저자  Investing
2024 년 12 월 18 일
Investing.com – 수요일 (현지시각) 연준(Fed)의 금리 발표를 앞두고 어제 각종 주요 지수들은 숨고르기에 들어갔다. 2024년 올 한해 각종 주요 지수들은 신고가를 경신하며 상승세를 이어가고 있다. 올해 초 16,300대였던 기술주 중심의 나스닥 100 지수는 현재 22,000대로 무려 34% 이상 상승하였다.나스닥 100은 S&P 500과
placeholder
리플 가격 연간 전망: XRP, 2025년에 새로운 고점에 도달할 수 있을까?리플(XRP)은 2024년 처음 10개월 동안 2021년 5월에 겪은 급격한 하락 이후 지속된 통합 패턴을 연장했습니다.
저자  FXStreet
2024 년 12 월 23 일
리플(XRP)은 2024년 처음 10개월 동안 2021년 5월에 겪은 급격한 하락 이후 지속된 통합 패턴을 연장했습니다.
placeholder
2025년 4월 솔라나 가격 전망: FTX의 5월 30일 8억 달러 상환으로 SOL 120달러 반락 리스크 확대솔라나(SOL) 가격은 화요일 130달러 이하에서 횡보세를 보였으며, 4월 들어 FTX 매도 물량 우려가 커지면서 점차 하방 압력에 직면하고 있다.
저자  FXStreet
4 월 02 일 수요일
솔라나(SOL) 가격은 화요일 130달러 이하에서 횡보세를 보였으며, 4월 들어 FTX 매도 물량 우려가 커지면서 점차 하방 압력에 직면하고 있다.
placeholder
상위 3개 가격 예측 비트코인, 이더리움, 리플: 강세 투자자, BTC 100,000달러, ETH 2,000달러, XRP 3달러 목표비트코인(BTC)은 수요일 현재 95,000달러 근처에서 안정세를 보이며, 돌파가 일어난다면 100,000달러로 향하는 상승을 예상할 수 있습니다. 이더리움(ETH)과 리플(XRP)은 비트코인의 흐름을 따라가며 각각 주요 지지선 근처에서 횡보하고 있습니다.
저자  FXStreet
4 월 30 일 수요일
비트코인(BTC)은 수요일 현재 95,000달러 근처에서 안정세를 보이며, 돌파가 일어난다면 100,000달러로 향하는 상승을 예상할 수 있습니다. 이더리움(ETH)과 리플(XRP)은 비트코인의 흐름을 따라가며 각각 주요 지지선 근처에서 횡보하고 있습니다.
goTop
quote