

USD/CAD Price Forecast: Extends winning streak for eighth trading day
- USD/CAD jumps above 1.3750 amid weakness in the Canadian Dollar ahead of Canada’s Employment data for September.
- The BoC is expected to cut interest rates further in the remainder of the year.
- The next move in the US Dollar will be influenced by the US PPI data for September.
The USD/CAD pair extends its winning spell for the eighth trading day on Friday. The Loonie pair strengthens and rises above 1.3750 amid sheer weakness in the Canadian Dollar (CAD). The Canadian currency exhibits weakness amid growing expectations that the Bank of Canada (BoC) will cut interest rates further in October.
The BoC has already reduced its borrowing rates by 75 basis points (bps) this year as price pressures have returned to the bank’s target of 2% and the labor market is weak. To get fresh insights of the current labor market status, investors will focus on the Employment data for September, which will be published at 12:30 GMT.
Economists expect the nation added 27K fresh workers, higher than 22.1K in August. The Unemployment Rate is estimated to have accelerated to 6.7% from the former print of 6.6%. Signs of a further slowdown in the labor demand could prompt expectations of a BoC 50 bps rate cut next month.
Meanwhile, the US Dollar (USD) edges higher ahead of the United States (US) Producer Price Index (PPI) data for September, which is scheduled at 12:30 GMT. The US Dollar Index (DXY), which gauges the Greenback’s value against six major currencies, trades close to 103.00.
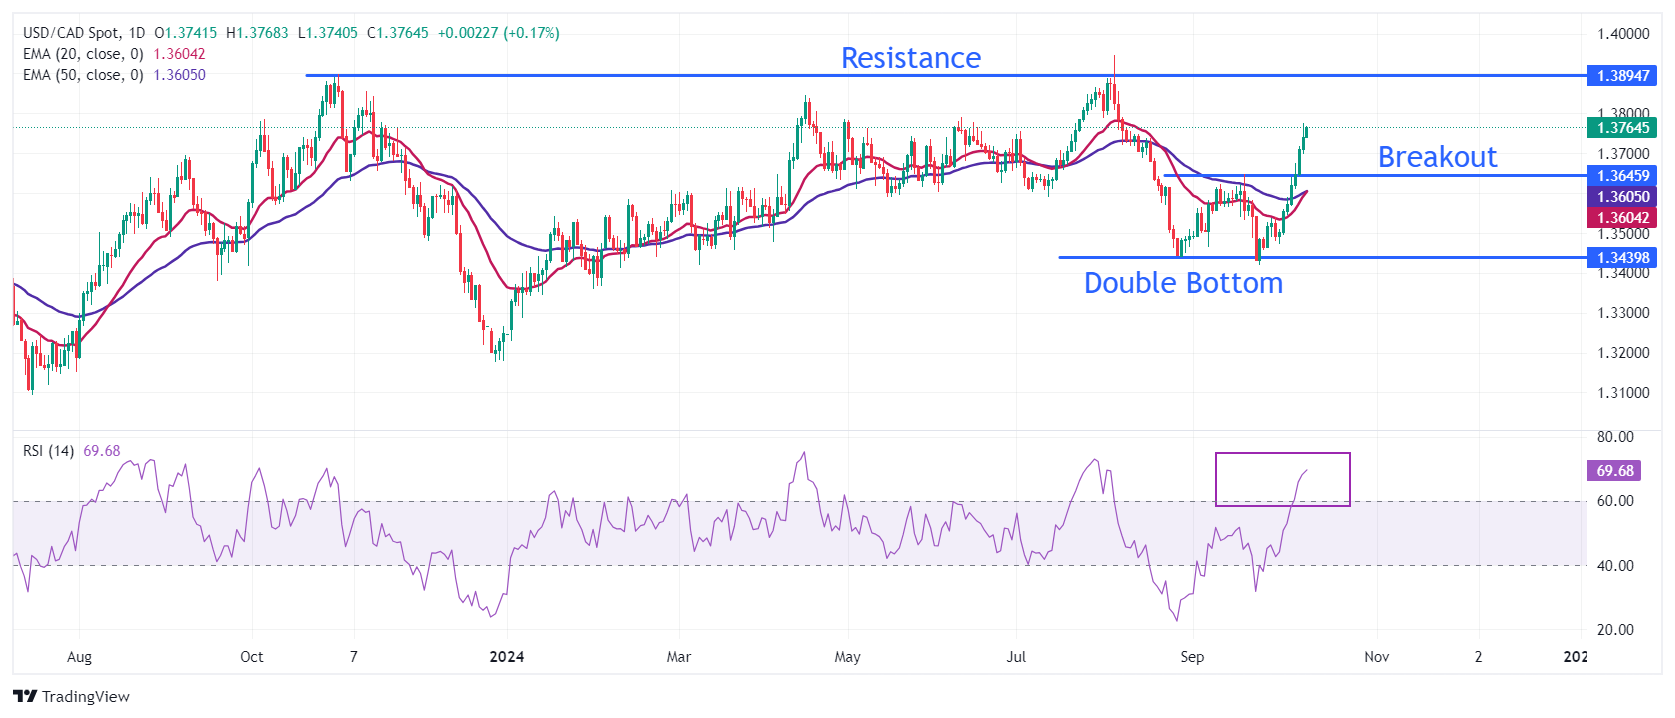
USD/CAD witnessed strong buying interest after a Double Bottom formation near 1.3440 on a daily timeframe. The bullish reversal formation got the green signal after a breakout above the September 19 high around 1.3650.
The near-term outlook of the Loonie pair will strengthen further as 20-and 50-day Exponential Moving Averages (EMAs) are on track to deliver a bull cross near 1.3600.
The 14-day Relative Strength Index (RSI) shifts into the bullish range of 60.00-80.00, suggesting a strong momentum on the upside.
More upside towards April 16 high of 1.3846 and Year-To-Date (YTD) high of 1.3945 would appear if the pair breaks above Thursday’s high of 1.3775.
In an alternate scenario, a downside move below the September 19 high around 1.3650 will expose the asset to May 16 low near 1.3600, followed by September 13 high of 1.3538.
USD/CAD daily chart
Canadian Dollar FAQs
The key factors driving the Canadian Dollar (CAD) are the level of interest rates set by the Bank of Canada (BoC), the price of Oil, Canada’s largest export, the health of its economy, inflation and the Trade Balance, which is the difference between the value of Canada’s exports versus its imports. Other factors include market sentiment – whether investors are taking on more risky assets (risk-on) or seeking safe-havens (risk-off) – with risk-on being CAD-positive. As its largest trading partner, the health of the US economy is also a key factor influencing the Canadian Dollar.
The Bank of Canada (BoC) has a significant influence on the Canadian Dollar by setting the level of interest rates that banks can lend to one another. This influences the level of interest rates for everyone. The main goal of the BoC is to maintain inflation at 1-3% by adjusting interest rates up or down. Relatively higher interest rates tend to be positive for the CAD. The Bank of Canada can also use quantitative easing and tightening to influence credit conditions, with the former CAD-negative and the latter CAD-positive.
The price of Oil is a key factor impacting the value of the Canadian Dollar. Petroleum is Canada’s biggest export, so Oil price tends to have an immediate impact on the CAD value. Generally, if Oil price rises CAD also goes up, as aggregate demand for the currency increases. The opposite is the case if the price of Oil falls. Higher Oil prices also tend to result in a greater likelihood of a positive Trade Balance, which is also supportive of the CAD.
While inflation had always traditionally been thought of as a negative factor for a currency since it lowers the value of money, the opposite has actually been the case in modern times with the relaxation of cross-border capital controls. Higher inflation tends to lead central banks to put up interest rates which attracts more capital inflows from global investors seeking a lucrative place to keep their money. This increases demand for the local currency, which in Canada’s case is the Canadian Dollar.
Macroeconomic data releases gauge the health of the economy and can have an impact on the Canadian Dollar. Indicators such as GDP, Manufacturing and Services PMIs, employment, and consumer sentiment surveys can all influence the direction of the CAD. A strong economy is good for the Canadian Dollar. Not only does it attract more foreign investment but it may encourage the Bank of Canada to put up interest rates, leading to a stronger currency. If economic data is weak, however, the CAD is likely to fall.
추천 기사


