

EUR/USD shrugs off the risk-off mood and weak data, pops up above 1.1700
- EUR/USD bounces up from 1.1670 and reaches session highs above 1.1700.
- The pair is on track for a weekly loss, as Middle East uncertainty hammered appetite for risk.
- The pair is set to find significant resistance in the 1.1740 area.
The Euro (EUR) is trimming some losses against the US Dollar (USD) on Friday, despite the risk-averse mood, amid the growing uncertainty in the Middle East. The pair is testing levels above 1.1700 ahead of the US session opening, after bouncing from two-week lows at 1.1670, still on track for a nearly 0.4% weekly loss.
The conflict in the Middle East remains front and center, and the escalating tensions between the US and Iran are keeping investors on edge. The ceasefire remains in play, but both countries have elevated their tone toward each other. US President Donald Trump urged Iran to sign a deal, and Israel said that it is waiting for a “US green light” to restart its attacks on Iran. Tehran, meanwhile, has warned that it will attack oilfields in Gulf countries if their energy sites are targeted.
In the Euro area, data released on Friday was not particularly supportive. The German IFO Business Climate index deteriorated in April to 84.4, its weakest reading since October 2022, amid higher energy costs stemming from the impact of the Middle East conflict. A few hours earlier, the French Consumer Confidence index showed a similar outcome.
In the US, the focus now is on the conference of Defense Secretary Pete Hegseth and Chairman of the Joint Chiefs of Staff General Dan Caine about the war in Iran, due at 08:00 (12:00 GMT). In Europe, all eyes will be on the European Central Bank (ECB) meeting due next Thursday. The bank is widely expected to keep interest rates on hold, but the market will be awaiting clear signs of a rate hike in the coming months. Anything other than that might send the Euro tumbling.
Technical Analysis: Key resistance lies at 1.1740
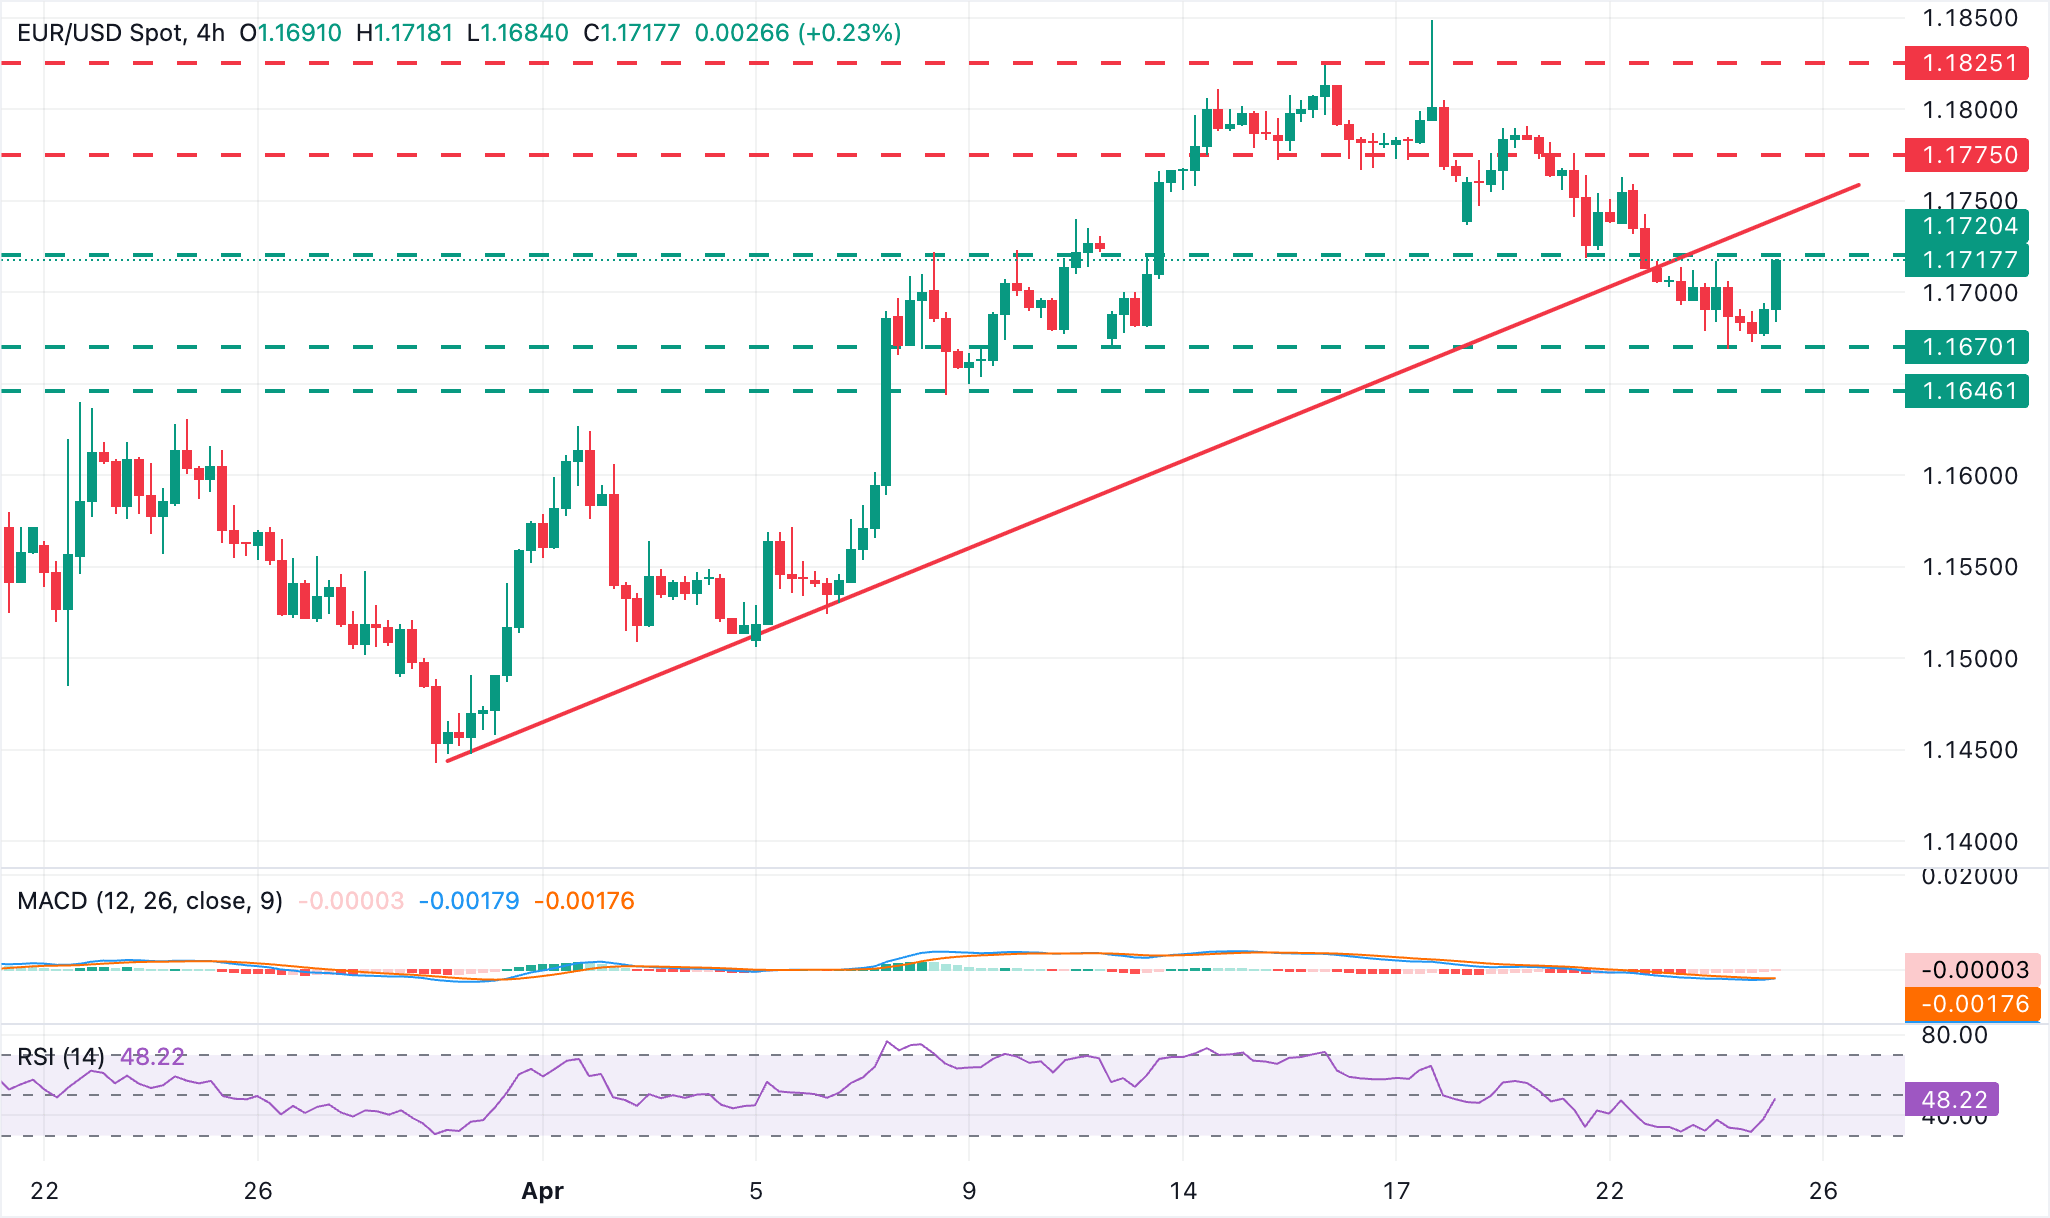
The EUR/USD has found buyers at the top of a cluster of support, between 1.1645 and 1.1770, to regain lost ground, although the immediate bias remains bearish. The 14-period Relative Strength Index (RSI) on the 4-hour chart stays below the neutral 50 line, and the Moving Average Convergence Divergence (MACD) indicator is still marginally negative, which points to a waning downside pressure rather than a clear bullish turn.
Initial resistance emerges at a previous support level around 1.1720 (April 21 low), but the key resistance is the reverse trendline, now at 1.1740. A confirmation beyond here is needed to ease bearish pressure and bring the 1.1775-1.1790 area back into focus.
On the downside, the support area between 1.1645 and 1.1670, is likely to give sellers a hard time. Further down, the next target is April's bottom, between 1.1505 and 1.1525.
(The technical analysis of this story was written with the help of an AI tool.)
Economic Indicator
IFO – Business Climate
This German business sentiment index released by the CESifo Group is closely watched as an early indicator of current conditions and business expectations in Germany. The Institute surveys more than 7,000 enterprises on their assessment of the business situation and their short-term planning. The positive economic growth anticipates bullish movements for the EUR, while a low reading is seen as negative (or bearish).
Read more.Last release: Fri Apr 24, 2026 08:00
Frequency: Monthly
Actual: 84.4
Consensus: 85.5
Previous: 86.4
Source: IFO Institute
Economic Indicator
Consumer Confidence
This index, released by INSEE, measures the moods of the consumers, through an analysis of a sample of houses. Consumers rate business conditions, labor market conditions and prospects for job and income growth.
Read more.Last release: Fri Apr 24, 2026 06:45
Frequency: Monthly
Actual: 84
Consensus: 88
Previous: 89
Source:
추천 기사


