

USD/INR inches lower after reaching fresh highs
- Indian Rupee holds ground amid possible intervention by the Reserve Bank of India.
- INR may decline as energy prices stay volatile and foreign investors continue pulling funds from local stocks.
- The US Dollar remains stronger amid the fading likelihood of Federal Reserve rate cuts.
USD/INR depreciates on Friday after reaching an all-time high of 92.90 in the previous session. The pair declines as the Indian Rupee (INR) strengthens, with the Reserve Bank of India (RBI) likely selling US Dollars (USD) to support the domestic currency amid rising Oil price concerns, traders told Reuters.
However, traders expect the INR to keep drifting lower as energy prices stay volatile and foreign investors continue pulling money from local stocks. Oil prices remain the key factor shaping sentiment across markets, including FX, bonds, and equities.
West Texas Intermediate (WTI) oil price edges lower after surging more than 9% in the previous session, trading near $94.50 per barrel at the time of writing. Oil prices declined after Chris Bowen, Australia’s Energy Minister, said the country would release up to 762 million litres of fuel from reserves after easing stockholding rules to address supply disruptions linked to the Iran conflict.
However, Oil prices may continue to rise due to shipping disruptions through the strategic Strait of Hormuz. Iran’s new Supreme Leader, Mojtaba Khamenei, said in his first public remarks since taking office that the closure of the Strait of Hormuz should remain a “tool to pressure the enemy.” Khamenei also warned that all US military bases in the region should be closed immediately or face potential attacks.
The USD/INR pair may also further strengthen as the US Dollar (USD) remains firm as futures markets and economists expect the Federal Reserve to keep interest rates unchanged at next week’s policy meeting, with the benchmark federal funds rate currently at 3.50%–3.75%.
Meanwhile, traders await another key US inflation release. January’s Personal Consumption Expenditures Price Index (PCE) — the Fed’s preferred inflation gauge — is due later in the day, though it will not reflect the impact of the Iran war. Markets will also monitor the fourth-quarter US GDP growth and March consumer confidence.
US inflation data suggested price pressures remain relatively contained, reinforcing expectations that the Fed may keep policy steady in the near term. Analysts also noted that the latest inflation figures do not yet fully capture the recent surge in oil prices driven by geopolitical tensions.
The February US Consumer Price Index (CPI) released on Wednesday showed inflation rising 0.3% month-over-month (MoM) and 2.4% year-over-year (YoY), largely in line with market expectations. Core CPI, which excludes food and energy, increased 0.2% MoM and 2.5% YoY.
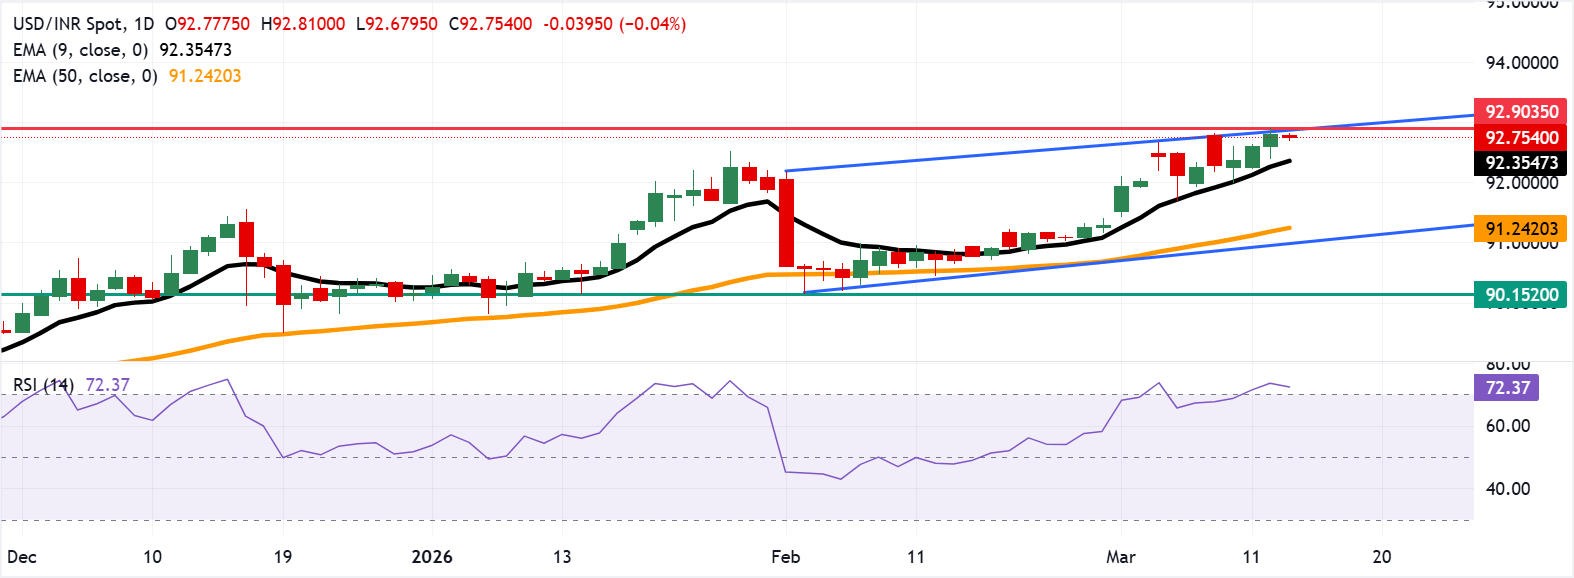
Technical Analysis: USD/INR tests channel’s upper boundary, all-time highs near 93.00
USD/INR trades around 92.70 at the time of writing on Friday. The technical analysis of the daily chart indicates a persistent bullish bias as the pair tests the upper boundary of the ascending channel.
The near-term bias is bullish as price holds well above both the nine- and 50-day Exponential Moving Averages (EMAs), which track an established advance from the 90.60 area. Momentum remains firm with the 14-day Relative Strength Index (RSI) at 71 within overbought territory.
The USD/INR pair tests the ascending channel’s upper boundary at the all-time high of 92.90, reached on March 12. On the downside, primary support lies at the nine-day EMA at 92.35. A break below this level would weaken the short-term momentum and expose the 50-day EMA at 91.24, followed by the channel’s lower boundary near 91.00.
US Dollar Price Today
The table below shows the percentage change of US Dollar (USD) against listed major currencies today. US Dollar was the strongest against the New Zealand Dollar.
| USD | EUR | GBP | JPY | CAD | AUD | NZD | INR | |
|---|---|---|---|---|---|---|---|---|
| USD | 0.08% | 0.08% | 0.08% | 0.03% | 0.19% | 0.39% | 0.09% | |
| EUR | -0.08% | -0.01% | 0.00% | -0.05% | 0.11% | 0.30% | -0.12% | |
| GBP | -0.08% | 0.00% | 0.00% | -0.04% | 0.12% | 0.30% | 0.02% | |
| JPY | -0.08% | 0.00% | 0.00% | -0.04% | 0.10% | 0.29% | -0.09% | |
| CAD | -0.03% | 0.05% | 0.04% | 0.04% | 0.14% | 0.33% | -0.03% | |
| AUD | -0.19% | -0.11% | -0.12% | -0.10% | -0.14% | 0.19% | -0.18% | |
| NZD | -0.39% | -0.30% | -0.30% | -0.29% | -0.33% | -0.19% | -0.39% | |
| INR | -0.09% | 0.12% | -0.02% | 0.09% | 0.03% | 0.18% | 0.39% |
The heat map shows percentage changes of major currencies against each other. The base currency is picked from the left column, while the quote currency is picked from the top row. For example, if you pick the US Dollar from the left column and move along the horizontal line to the Japanese Yen, the percentage change displayed in the box will represent USD (base)/JPY (quote).
Indian Rupee FAQs
The Indian Rupee (INR) is one of the most sensitive currencies to external factors. The price of Crude Oil (the country is highly dependent on imported Oil), the value of the US Dollar – most trade is conducted in USD – and the level of foreign investment, are all influential. Direct intervention by the Reserve Bank of India (RBI) in FX markets to keep the exchange rate stable, as well as the level of interest rates set by the RBI, are further major influencing factors on the Rupee.
The Reserve Bank of India (RBI) actively intervenes in forex markets to maintain a stable exchange rate, to help facilitate trade. In addition, the RBI tries to maintain the inflation rate at its 4% target by adjusting interest rates. Higher interest rates usually strengthen the Rupee. This is due to the role of the ‘carry trade’ in which investors borrow in countries with lower interest rates so as to place their money in countries’ offering relatively higher interest rates and profit from the difference.
Macroeconomic factors that influence the value of the Rupee include inflation, interest rates, the economic growth rate (GDP), the balance of trade, and inflows from foreign investment. A higher growth rate can lead to more overseas investment, pushing up demand for the Rupee. A less negative balance of trade will eventually lead to a stronger Rupee. Higher interest rates, especially real rates (interest rates less inflation) are also positive for the Rupee. A risk-on environment can lead to greater inflows of Foreign Direct and Indirect Investment (FDI and FII), which also benefit the Rupee.
Higher inflation, particularly, if it is comparatively higher than India’s peers, is generally negative for the currency as it reflects devaluation through oversupply. Inflation also increases the cost of exports, leading to more Rupees being sold to purchase foreign imports, which is Rupee-negative. At the same time, higher inflation usually leads to the Reserve Bank of India (RBI) raising interest rates and this can be positive for the Rupee, due to increased demand from international investors. The opposite effect is true of lower inflation.
추천 기사


