


Meme Coins Price Prediction: DOGE, SHIB, and PEPE rally, catching Bitcoin's second wind
- Dogecoin holds steady on Wednesday after Tuesday's 8% rise ended the seven-day decline.
- Shiba Inu takes a breather after a 7% rebound on Tuesday from the 50-day EMA.
- Pepe is up over 2% on Wednesday, extending the 14% gains from the previous day.
Meme coins such as Dogecoin (DOGE), Shiba Inu (SHIB), and Pepe (PEPE) recorded gains of 7% to 14% on Tuesday, signaling a potential reversal to the upside. DOGE and SHIB hold steady after the bounce back while the frog-themed PEPE extends gains, signaling further upside potential.
Dogecoin eyes further gains toward a crucial resistance level
Dogecoin holds above the 50-day Exponential Moving Average (EMA) at $0.1433, following the 8% jump on Tuesday. At the time of writing, DOGE approaches the $0.1500 psychological mark on Wednesday, following an 8% surge on the previous day.
The dog-themed meme coin could face resistance at $0.1568, a level that capped gains in late November and earlier this month. If DOGE clears this level, it could aim for the 200-day EMA at $0.1786.
The technical indicators on the daily chart suggest increased bullish interest in the meme coin. The Relative Strength Index (RSI) at 59 holds between the halfway line and the overbought zone, indicating increased buying pressure.
At the same time, the Moving Average Convergence Divergence (MACD) rises to avoid converging with the signal line, indicating renewed bullish momentum.
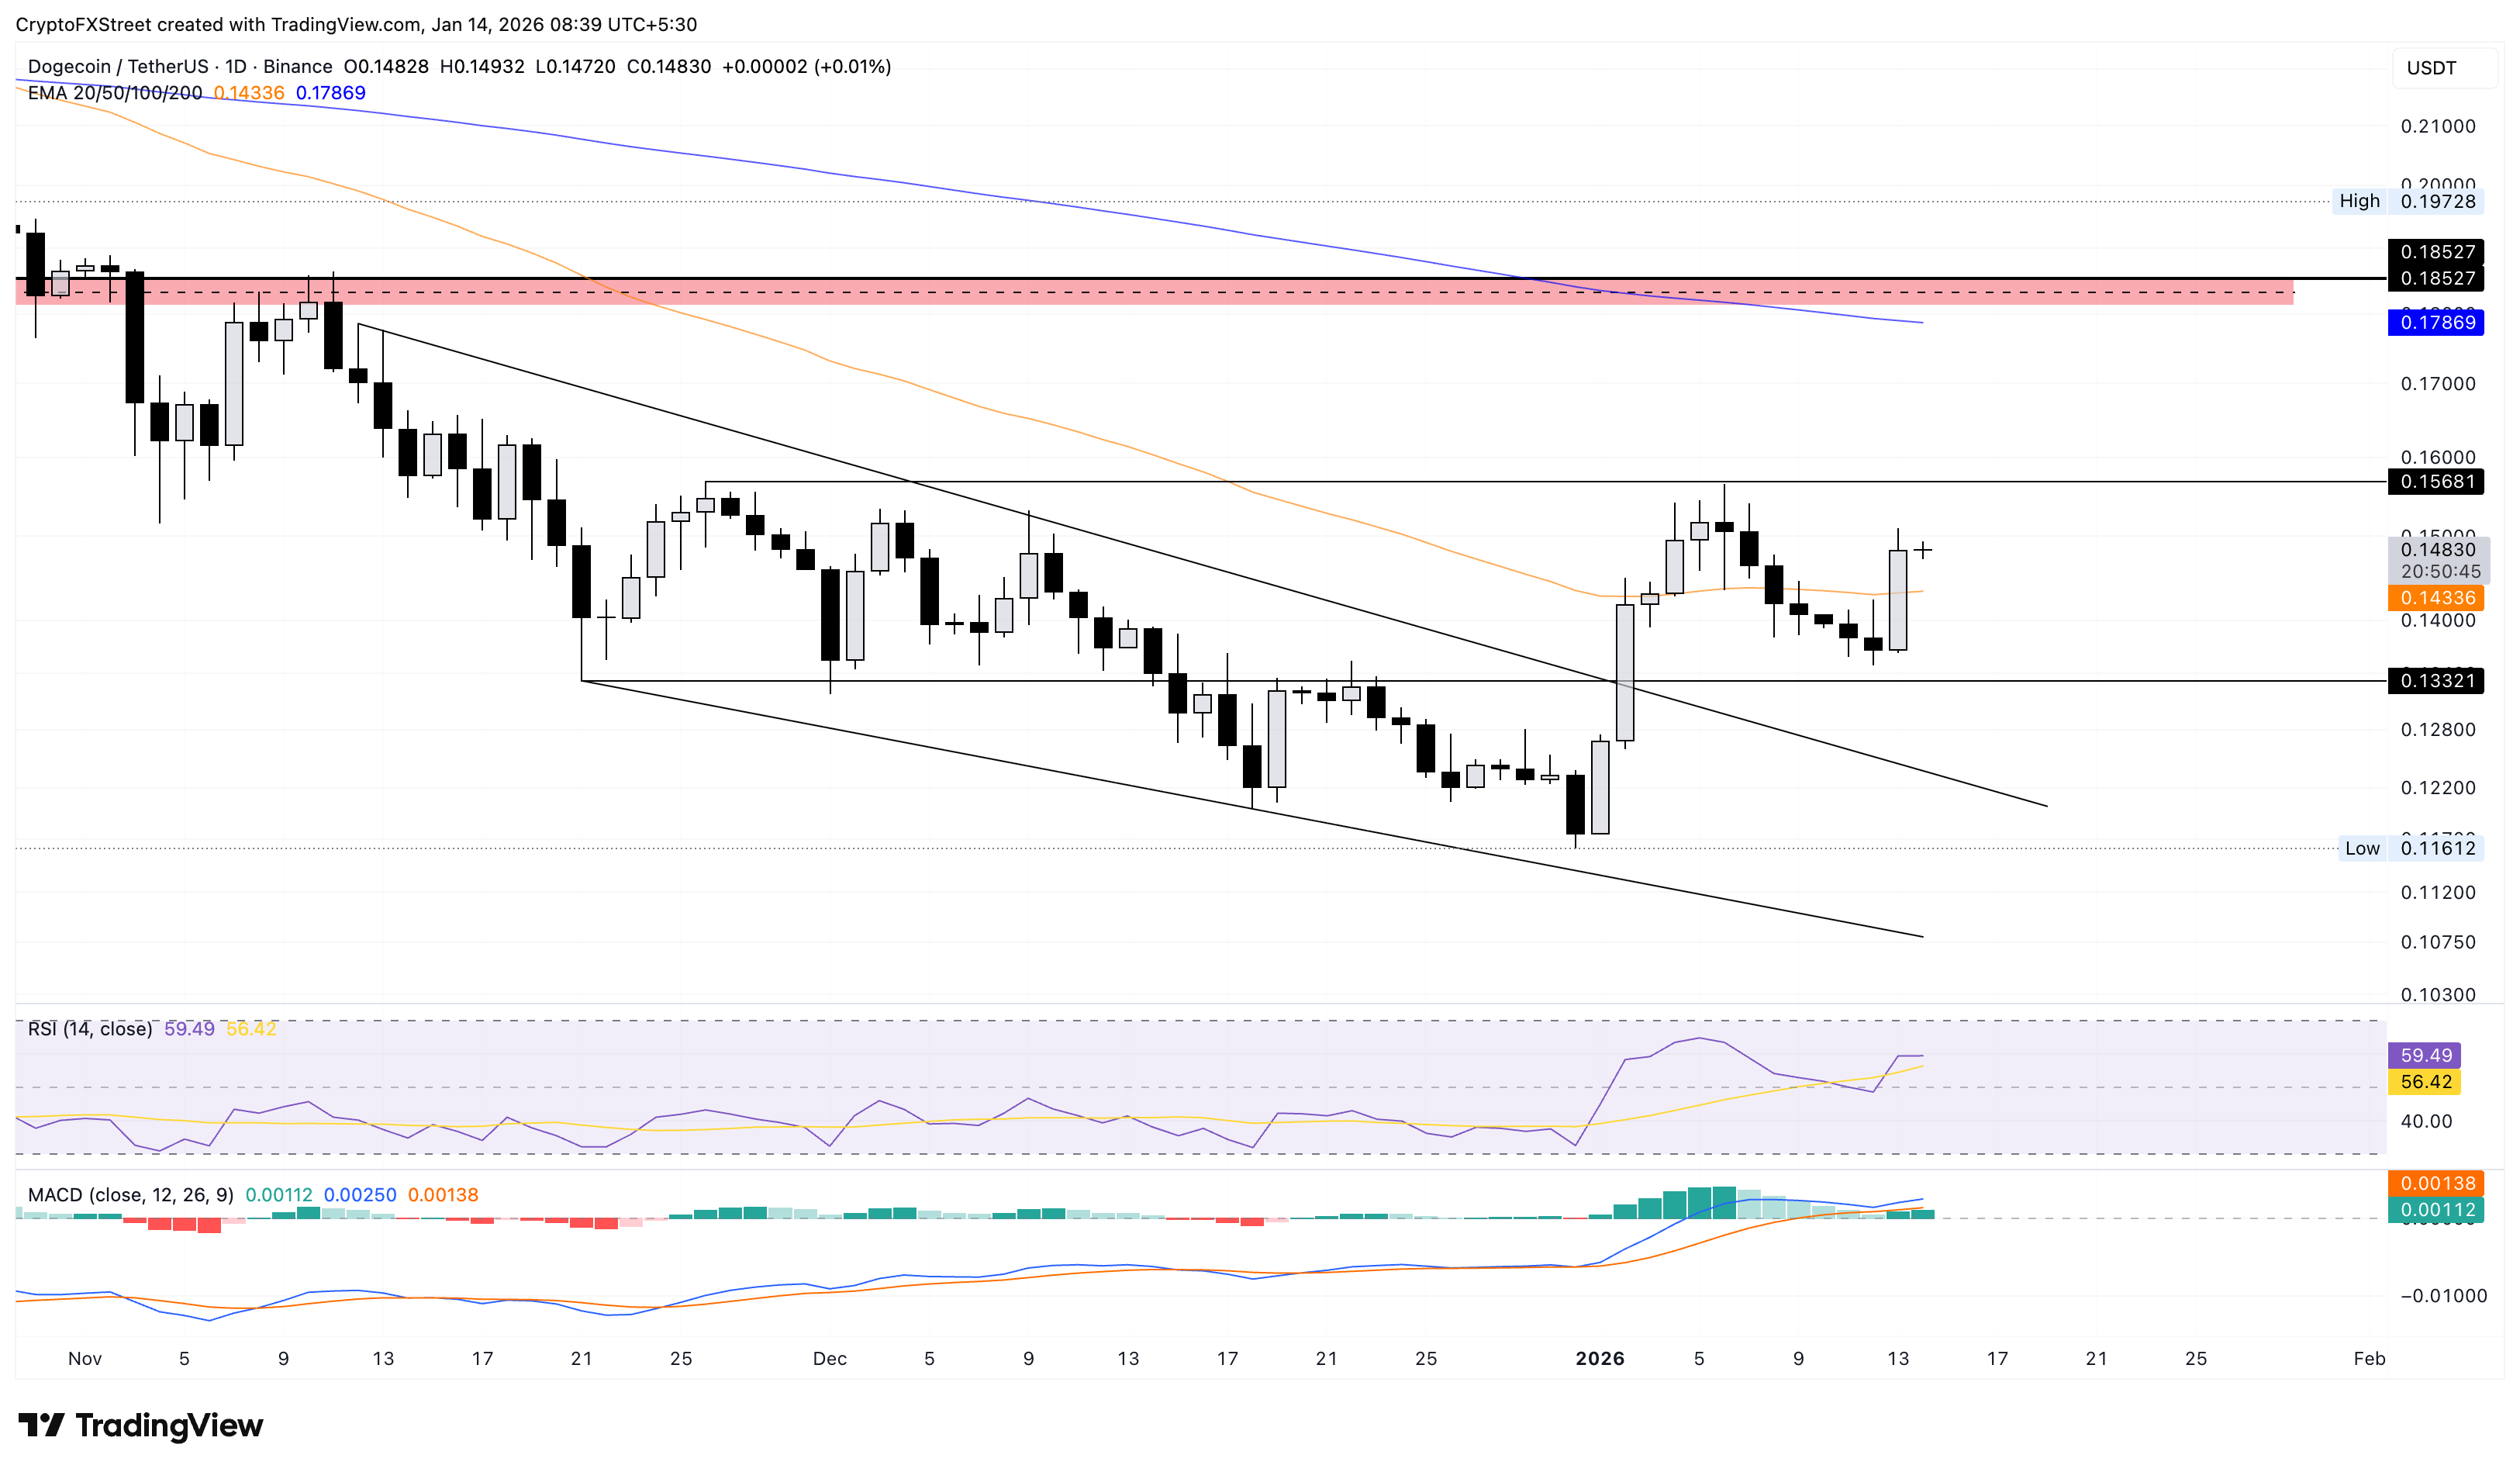
If DOGE reverses from $0.1500, it could retest the $0.1332 support marked by the November 21 low.
Shiba Inu’s rebound faces headwinds
Shiba Inu edges lower by 1% at press time on Wednesday, pulling back after the 7% rebound from the 50-day EMA at $0.00000838 on Tuesday. The meme coin struggles to reach $0.00000924, a resistance level that has held since late November.
If SHIB exceeds this level, it could target the 200-day EMA at $0.00001049.
Similar to DOGE, the RSI is at 59, and the MACD is rebounding to avoid a crossover with the signal line, signaling renewed buying pressure.
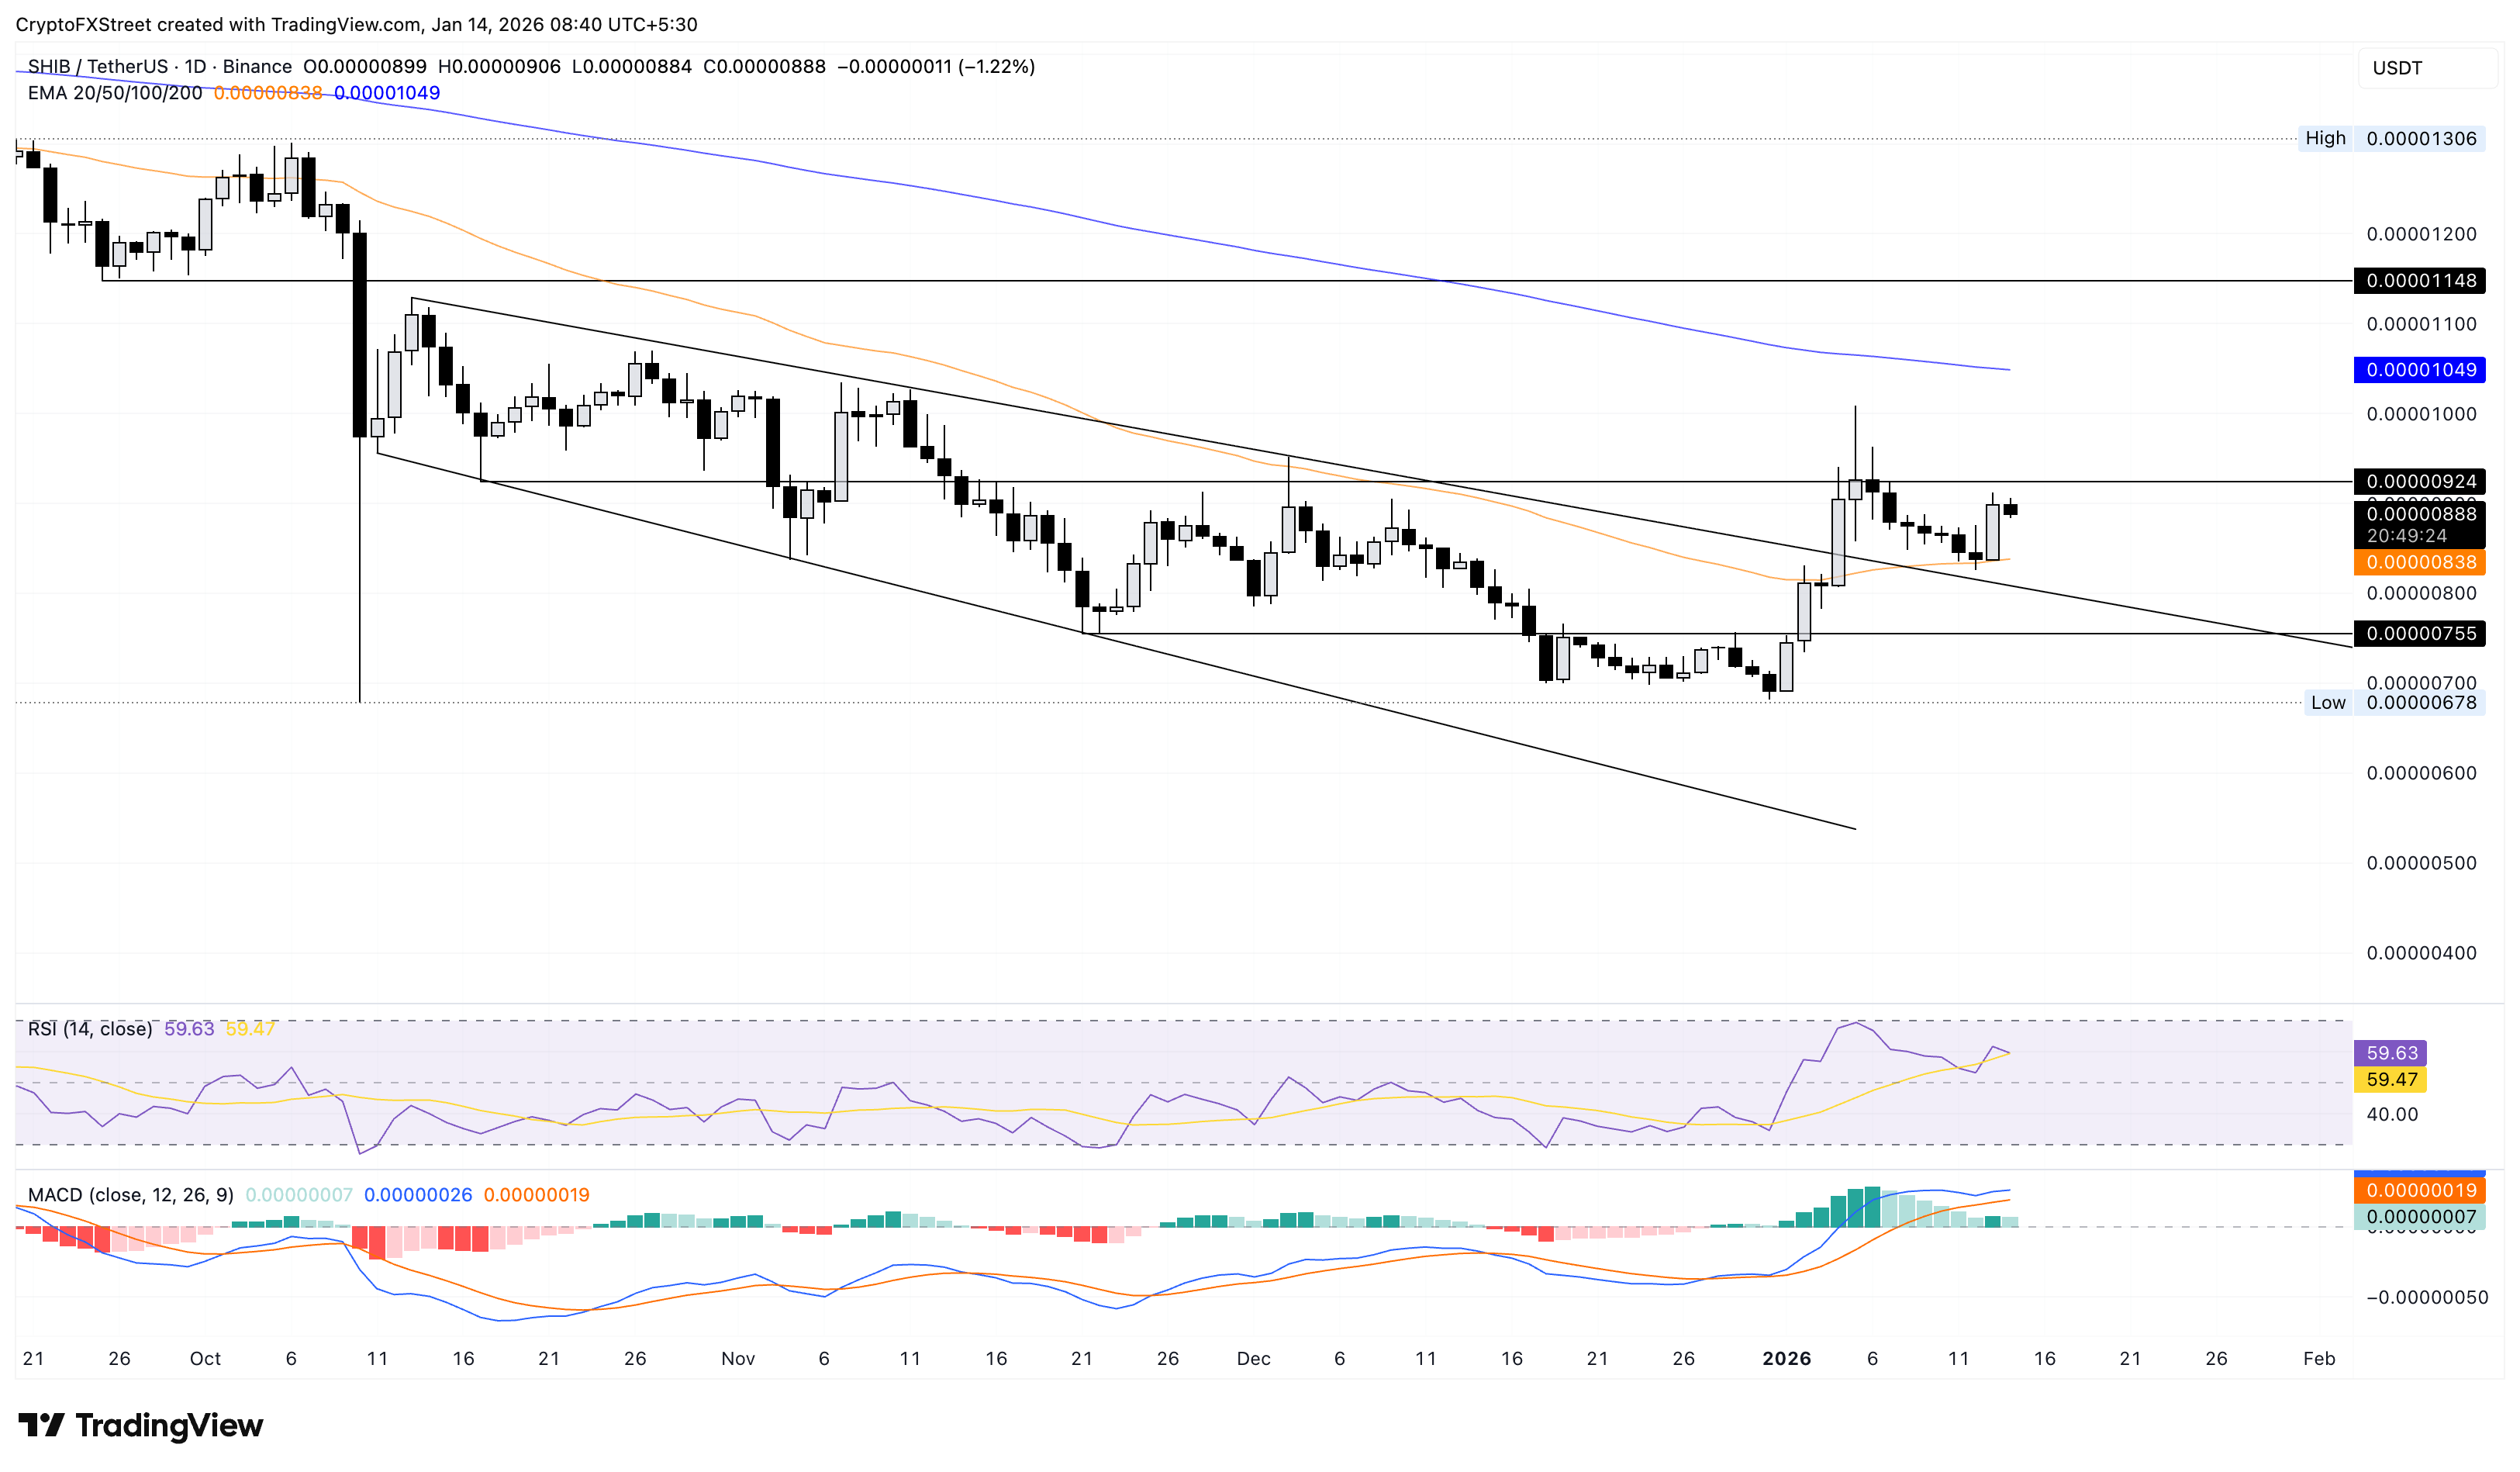
On the downside, if SHIB slips below the 50-day EMA at $0.00000838, it could test the November 21 low at $0.00000755.
Pepe’s recovery inches toward the 200-day EMA
Pepe is up 2% at press time on Wednesday, extending the 14% gains from the previous day. The frog-themed meme coin is targeting the 200-day EMA at $0.00000738 as its immediate resistance.
Corroborating the upside potential, the RSI at 66 rises toward the overbought zone while the MACD bounces off the signal line, extending the upward trend.
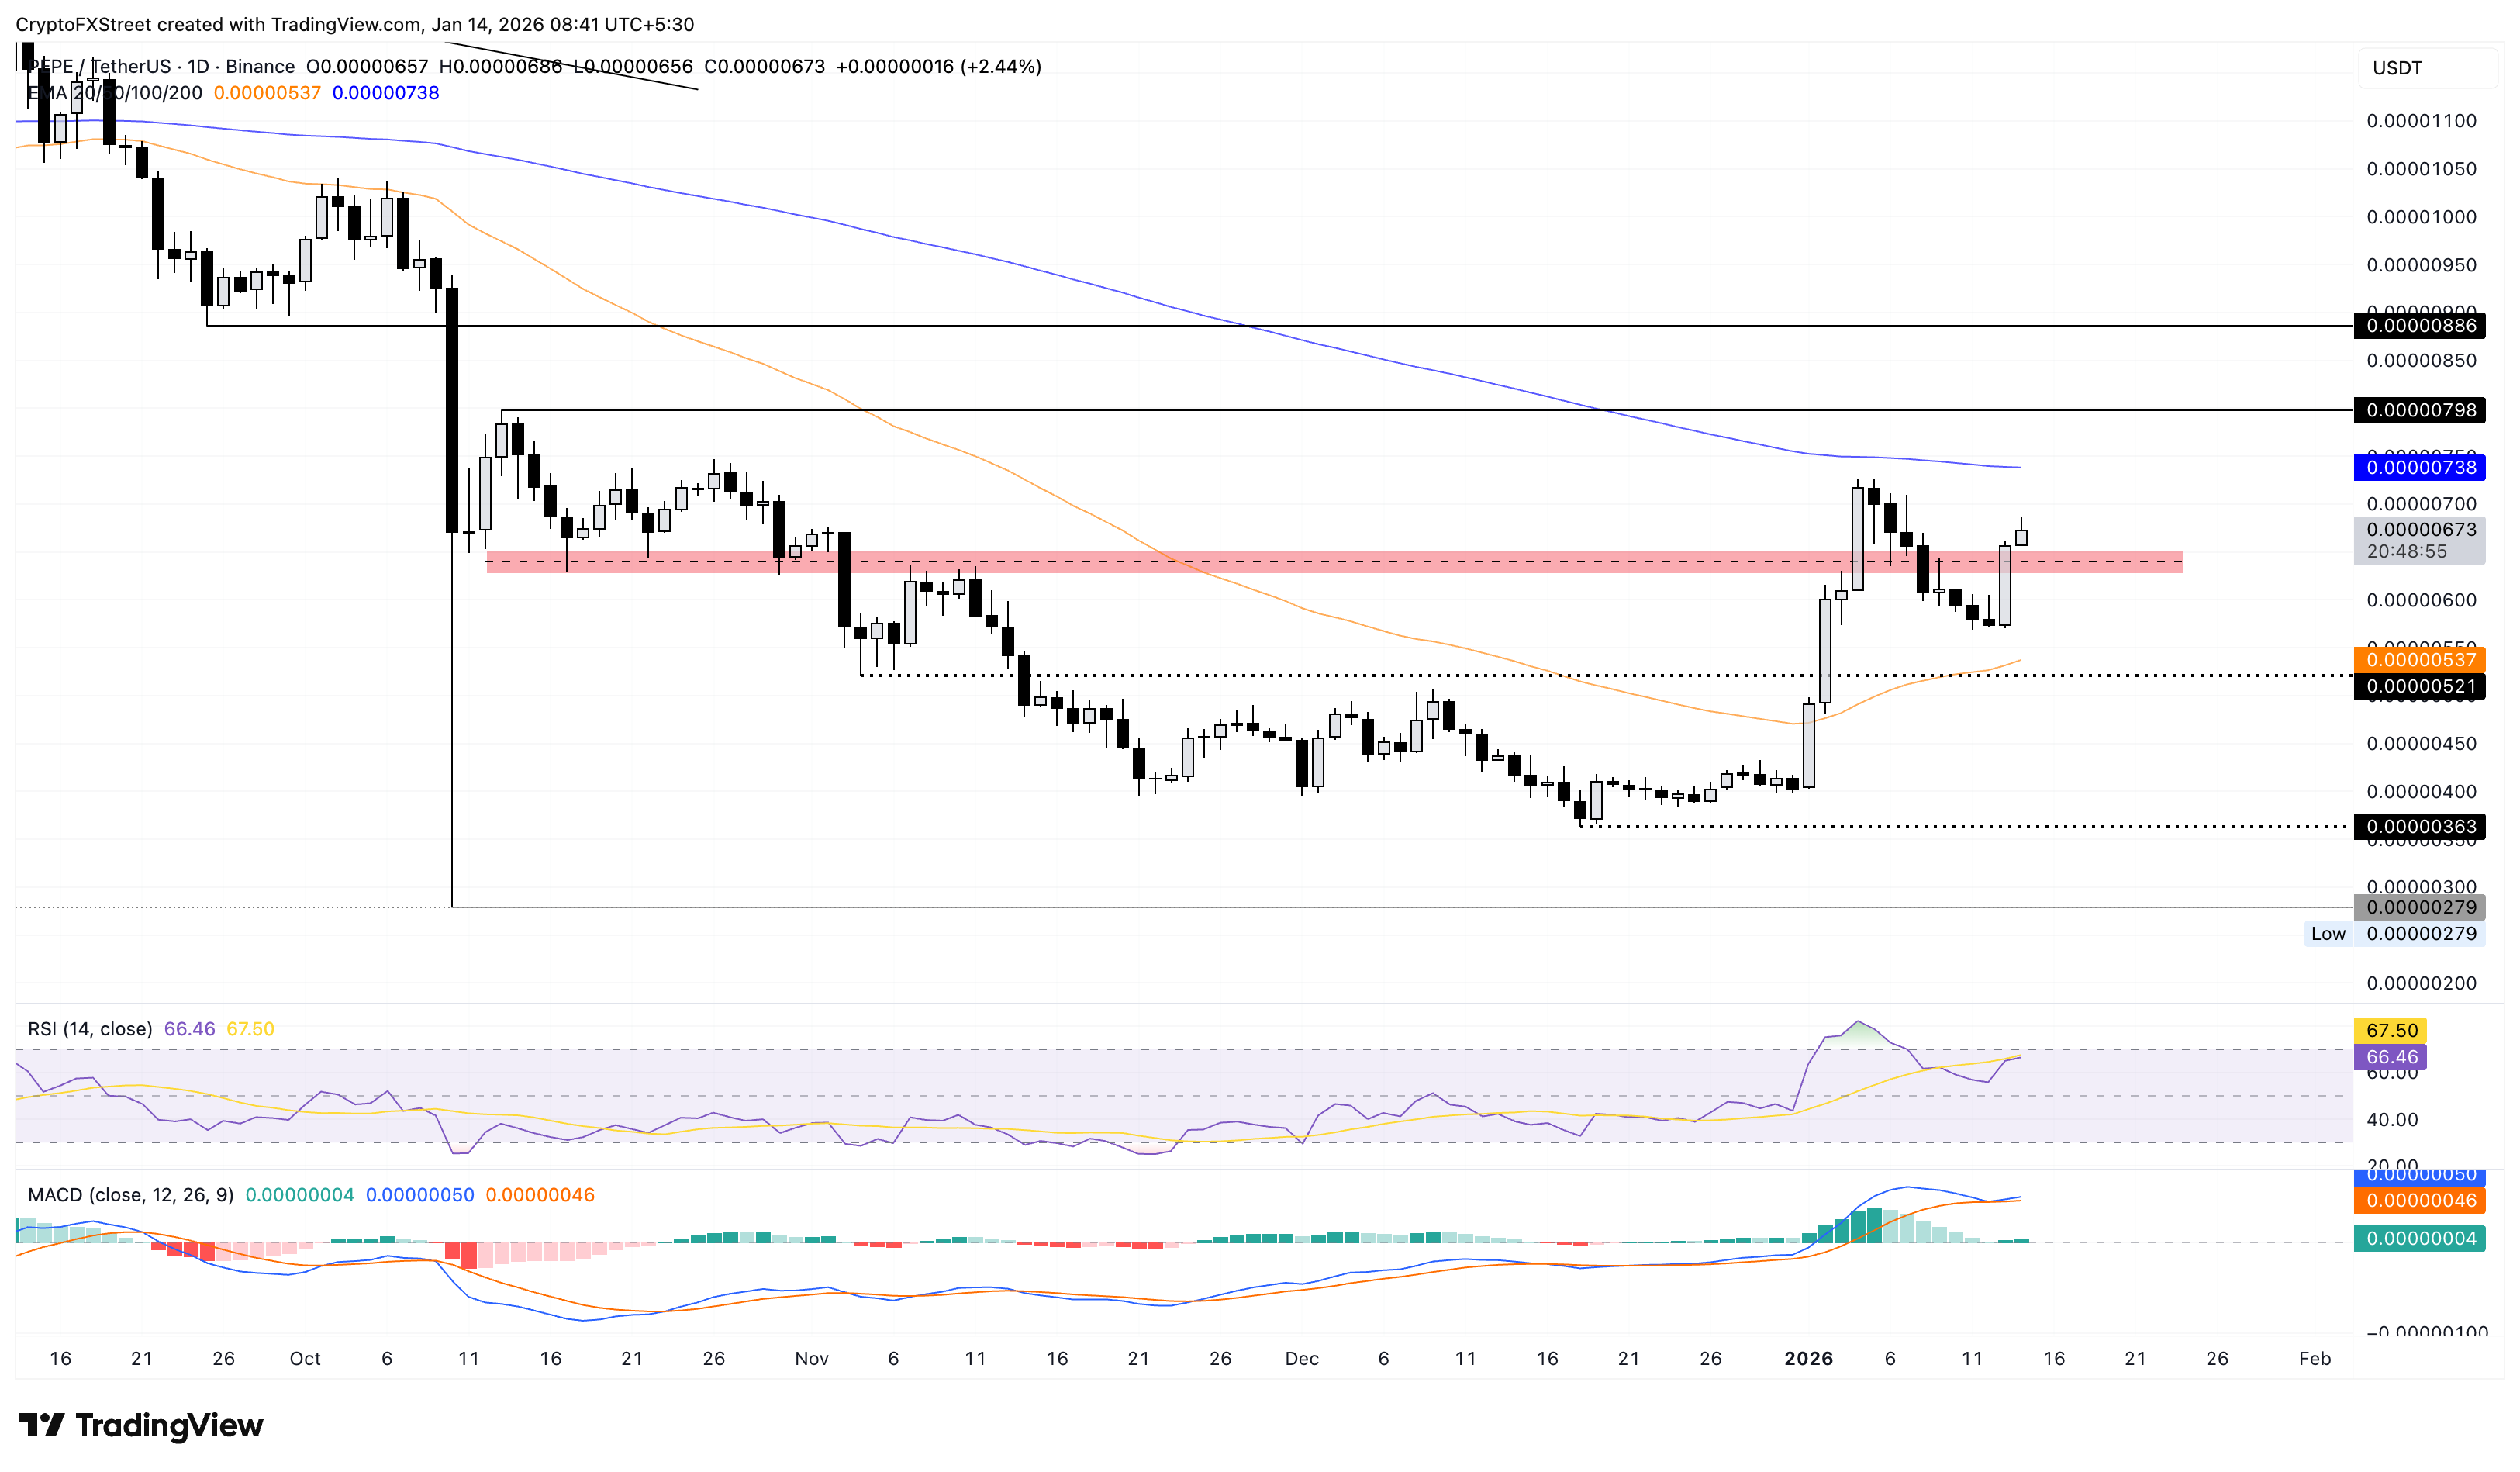
On the flip side, the 50-day EMA at $0.00000537 remains a crucial support for PEPE.
추천 기사


