Target vs. Walmart: What's the Better Dividend Stock to Buy and Hold?

Mitrade
coverImg
Source: DepositPhotos

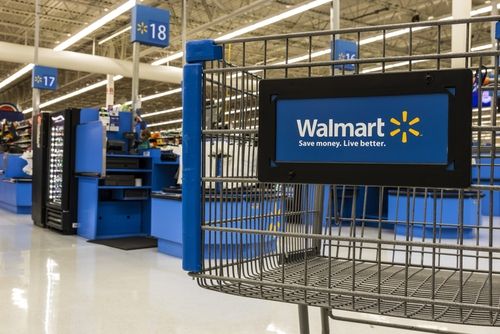
Target (NYSE: TGT) and Walmart (NYSE: WMT) are top retail stocks that can give investors a good way to invest in the economy's long-term growth. They can also generate a lot of dividend income for your portfolio. This year, Walmart has been the clear winner in terms of sheer stock performance, generating year-to-date returns of around 75% versus a 9% decline for Target, at the time of this writing.


But for dividend investors, the priorities will be a bit different. While Target is vastly underperforming Walmart today, that may not necessarily be the case for the next 10-plus years, which is how long dividend investors may be thinking about holding on to an investment.


If your priority is a good dividend stock and you're looking at holding on to an investment for the long haul, I'll look at which of these stocks may be the better option for you right now.


Target offers a much higher payout today


When a dividend stock surges the way Walmart has, that shrinks its yield as it means investors will need to pay more money to collect the same dividend. Walmart's yield is right around 1% today, which is below the S&P 500 average of approximately 1.2%. If, however, the stock was trading at the levels it was at to start the year, its yield would be approximately 1.6%.Target, by comparison, yields 3.4%.


To collect a $1,000 dividend from Walmart over the course of a full year, you would need to invest around $100,000 given its fairly low yield. But with a much higher payout, you would need to invest less than $30,000 into Target stock to collect the same level of dividend income.


Both companies have been growing their dividend payments


For dividend investors, a key criteria to consider when evaluating stocks is also the likelihood that they will increase their dividend income in the future, to not just grow the cash flow but to help offset the effects of inflation.


Earlier this year, Target raised its dividend by just under 2%, which marked the 53rd consecutive year which it boosted its dividend. As a Dividend King, Target has established itself as a top dividend growth stock to buy and hold over the years. Walmart is also part of that club, and in February it increased its quarterly dividend by 9%. The big-box retailer has now raised its dividend for 51 straight years.


While the recent increase was larger for Walmart, it's Target which has made the more generous raises over the past decade, doubling its dividend over that time frame.


TGT Dividend Chart

TGT Dividend data by YCharts


Both dividends look safe and sustainable


Another important metric to consider is the payout ratio, which tells investors just how much of its earnings a company is paying out in dividends. Both of these stocks have payout ratios of less than 50%, with Walmart having a bit more of a buffer than its rival.


TGT Payout Ratio Chart

TGT Payout Ratio data by YCharts


A lower payout ratio doesn't mean that Walmart's future increases will be larger than Target's. The company may prefer to keep its payout ratio low and manageable, as distributing too much of earnings out to shareholders could drain its cash, which it may prefer to use on its growth strategies, especially as it continues to battle Amazon.


What the above chart does tell investors, however, is that both dividend payments from Target and Walmart are currently safe and manageable, and there is room for more rate hikes in the future.


Dividend investors may want to consider Target


Target has been struggling this year due to underwhelming demand for discretionary products. But as economic conditions improve in the long run, the tide could change. And with Walmart also trading at a far higher valuation (34 times next year's estimated earnings versus a multiple of 13 for Target), it may be more susceptible to a correction, making Target the better value option for investors.


If you're investing for the long haul and dividend income is important to you, then buying shares of Target could be the better move to make today than jumping onto Walmart's already hot bandwagon.

Read more

  • Gold Hits Near 1.5-Year Low Below $3,800 as Bears Threaten Drop to $3,500
  • Bitcoin Plunges 13% in a Week as Market Retreats to $60,000 Level
  • Nvidia Q3 Earnings Loom as Market Expects Revenue Near $109 Billion: Can NVDA Stock Hold $150?
  • * The content presented above, whether from a third party or not, is considered as general advice only.  This article should not be construed as containing investment advice, investment recommendations, an offer of or solicitation for any transactions in financial instruments.

    goTop
    quote
    Related Articles
    placeholder
    Nvidia posts record $115.8B Q3 revenue, but crypto stays mutedThe crypto market remained subdued on Tuesday despite Nvidia's (NVDA) Q3 earnings release beating analysts' expectations as demand for artificial intelligence infrastructure continued to drive growth across its business.
    Author  FXStreet
    Yesterday 01: 46
    The crypto market remained subdued on Tuesday despite Nvidia's (NVDA) Q3 earnings release beating analysts' expectations as demand for artificial intelligence infrastructure continued to drive growth across its business.
    placeholder
    Nvidia Q3 Earnings Loom as Market Expects Revenue Near $109 Billion: Can NVDA Stock Hold $150? As of the close on November 16 ET, Nvidia (NVDA) shares fell 4.12% to close at $156.14, with an intraday low of $155.01 and trading volume of about 334 million shares. Compared with its p
    Author  TradingKey
    Nov 17, Tue
    As of the close on November 16 ET, Nvidia (NVDA) shares fell 4.12% to close at $156.14, with an intraday low of $155.01 and trading volume of about 334 million shares. Compared with its p
    placeholder
    Weekly Report: The index rose 2.5% while Nvidia fell 12.7% — two equity divergences, one should closeThe S&P 500 rose 2.51% to 7,561.67 and the QQQ rose 3.63% to 679.89 last week, while Nvidia fell 12.75% to 162.85 — a sixth straight weekly loss and 32% below its October record. In the same five sessions, energy equities rose 5.42% while WTI fell 2.52%. Both pairs normally move together (60-day correlations of +0.64 and +0.58). This report ranks which divergence closes first, with the trigger for each.
    Author  Irene Q.
    Nov 16, Mon
    The S&P 500 rose 2.51% to 7,561.67 and the QQQ rose 3.63% to 679.89 last week, while Nvidia fell 12.75% to 162.85 — a sixth straight weekly loss and 32% below its October record. In the same five sessions, energy equities rose 5.42% while WTI fell 2.52%. Both pairs normally move together (60-day correlations of +0.64 and +0.58). This report ranks which divergence closes first, with the trigger for each.
    placeholder
    Anthropic is six times oversubscribed at $1.4 trillion while Nvidia is down 32% — the AI trade has two pricesAnthropic lists on Nasdaq as ANT on Thursday at $70 ~ $78 a share, raising up to $64.4 billion at a target valuation near $1.4 trillion, and the book is reportedly six times covered. In the same six weeks, Nvidia has fallen 32% and the QQQ is 10.9% below its October peak. Private capital and public markets are marking the same AI complex at two very different prices. This piece separates the two books: what the S-1 shows, who is anchoring the $26 billion private placement, and what Thursday's debut would have to do to change the public tape.
    Author  Irene Q.
    Nov 16, Mon
    Anthropic lists on Nasdaq as ANT on Thursday at $70 ~ $78 a share, raising up to $64.4 billion at a target valuation near $1.4 trillion, and the book is reportedly six times covered. In the same six weeks, Nvidia has fallen 32% and the QQQ is 10.9% below its October peak. Private capital and public markets are marking the same AI complex at two very different prices. This piece separates the two books: what the S-1 shows, who is anchoring the $26 billion private placement, and what Thursday's debut would have to do to change the public tape.
    placeholder
    Nvidia reports tomorrow with an interim CEO — $108 billion is the easy numberNvidia closed at 162.85 on Friday, down 12.75% on the week and 32% below its 6 October record, with market value down to $3.92 trillion. The Q3 bar is $108 billion ±2%, and consensus already sits at $108.7 ~ 108.8 billion, so the revenue line is not where the surprise lives. The number that decides the reaction is the 71 ~ 72% Q4 gross-margin trough, followed by a Q4 guide against a $124.9 billion consensus. This piece prices the print, marks the 158.39 line and lays out the three scenarios in a table.
    Author  Irene Q.
    Nov 16, Mon
    Nvidia closed at 162.85 on Friday, down 12.75% on the week and 32% below its 6 October record, with market value down to $3.92 trillion. The Q3 bar is $108 billion ±2%, and consensus already sits at $108.7 ~ 108.8 billion, so the revenue line is not where the surprise lives. The number that decides the reaction is the 71 ~ 72% Q4 gross-margin trough, followed by a Q4 guide against a $124.9 billion consensus. This piece prices the print, marks the 158.39 line and lays out the three scenarios in a table.
    Live Quotes
    Name / SymbolChart% Change / Price
    TGT
    TGT
    0.00%0.00
    WMT
    WMT
    0.00%0.00

    US Stocks Related Articles

    • 10 Best Day Trading Platforms for Beginners and Active Traders in 2026: A Practical Guide
    • How To Invest in SpaceX Stock in 2026? Everything Investors Need to Know
    • Practice Trading Us Stocks? These Are 10 Best Stock Trading Demo Apps For Beginners
    • ​5 Best Paper Trading Platforms for 2026 (Free Demo Accounts for Beginners & Traders)
    • Wall Street’s Top 10 US Stocks for 2026 vs What Reddit Is Actually Buying
    • Is Mitrade Right for You? A Complete Guide on How to Start Trading CFDs in 5 Steps

    Click to view more