

CME Group Inc Stock (CME) Moved Down by 3.85% on Mar 10: Key Drivers Unveiled
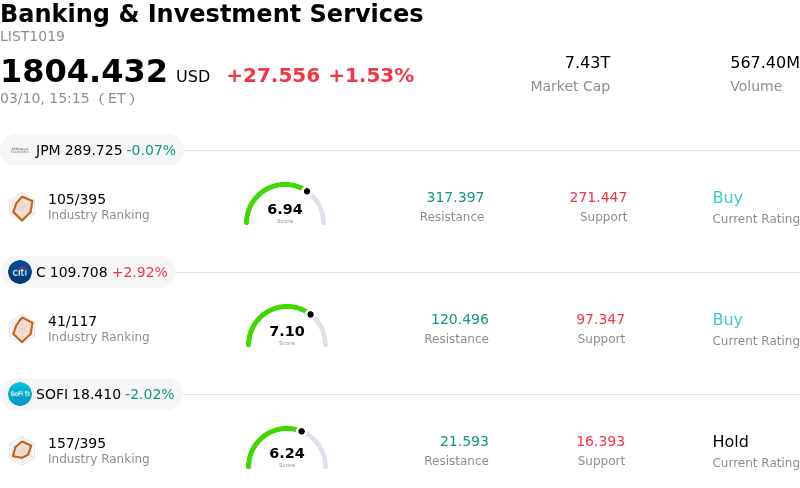
CME Group Inc (CME) moved down by 3.85%. The Banking & Investment Services sector is up by 1.53%. The company underperformed the industry. Top 3 stocks by turnover in the sector: JPMorgan Chase & Co (JPM) down 0.07%; Citigroup Inc (C) up 2.92%; SoFi Technologies Inc (SOFI) down 2.02%.
What is driving CME Group Inc (CME)’s stock price down today?
CME Group's shares experienced downward pressure today, largely attributed to the stock trading ex-dividend. On the ex-dividend date, the share price typically adjusts lower by approximately the value of the distribution, which in this case included a significant combined payout from both the regular quarterly dividend and an annual variable dividend.
Adding to the selling sentiment, Argus Research recently downgraded CME Group from a Buy to a Hold rating on March 4, citing expectations of limited growth across several key contract areas, such as equity index, metals, cryptocurrency, and micro contracts primarily traded by retail investors. This analyst revision, despite some other analysts maintaining positive outlooks and even raising price targets, contributes to a cautious view among investors.
Furthermore, the stock's valuation metrics suggest it has been trading near historical highs, with technical indicators hinting at overbought conditions, which could make it susceptible to a price correction or profit-taking. While the company did announce record single-day trading volumes in its energy complex earlier this month, suggesting strong operational activity, these positive developments appear to have been overshadowed by other factors influencing today's trading.
News of institutional investors reducing their stakes in the company during a recent quarter, as well as an earlier share sale by the CEO, may also contribute to underlying investor sentiment, even if these events are not new to the market today. The cumulative effect of the ex-dividend adjustment and prevailing analyst and market sentiment has likely influenced today's share movement.
Technical Analysis of CME Group Inc (CME)
Technically, CME Group Inc (CME) shows a MACD (12,26,9) value of [8.41], indicating a neutral signal. The RSI at 62.84 suggests neutral condition and the Williams %R at -33.93 suggests oversold condition. Please monitor closely.
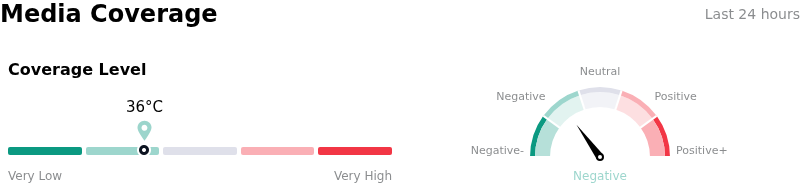
Media Coverage of CME Group Inc (CME)
In terms of media coverage, CME Group Inc (CME) shows a coverage score of 36, indicating a low level of media attention. The overall market sentiment index is currently in bearish zone.
Fundamental Analysis of CME Group Inc (CME)
CME Group Inc (CME) is in the Banking & Investment Services industry. Its latest annual revenue is $11.95B, ranking 18 in the industry. The net profit is $4.02B, ranking 8 in the industry. Company Profile
Over the past month, multiple analysts have rated the company as Hold, with an average price target of $308.47, a high of $356.00, and a low of $232.00.
More details about CME Group Inc (CME)
Company Specific Risks:
- Argus Research downgraded CME Group to Hold on March 4, 2026, citing expectations of limited growth across key contract areas including equity index, metals, cryptocurrency, and micro contracts, particularly from retail investors, which led to a share price decline.
- Valuation analysis suggests CME shares may be significantly overvalued, with GuruFocus estimating a 15.75% downside from current prices and Simply Wall St indicating the stock is trading 31.7% above its estimated fair value.
- CME's Globex electronic trading platform experienced a significant outage on February 26, 2026, which temporarily halted trading in critical gold, copper, and natural gas markets, highlighting inherent operational vulnerabilities and potential needs for accelerated infrastructure investments.
- Insider selling activity, including an indirect open-market sale of 1,000 shares by a CME Group director on March 6, 2026, and a mixed picture with four insider selling transactions over the past three months, may signal a lack of confidence from company leadership.
Recommended Articles


