


YieldMax MSTR Option Income Strategy ETF: Buy, Sell, or Hold in 2026?
Key Points
This ETF carries one of the biggest yields around.
It's tempting, but investors need to examine how that income stream is sourced.
Given the limits on upside potential, the juice may not be worth the squeeze.
- 10 stocks we like better than Tidal Trust II - YieldMaxTM Mstr Option Income Strategy ETF ›
Experienced income investors know about yield traps: stocks with unusually high dividend yields that go on to cut or suspend those payments. The lesson is simple: When something looks too good to be true, it usually is.
That lesson applies to some high-income exchange-traded funds (ETFs), including the YieldMax MSTR Option Income Strategy ETF (NYSEMKT: MSTY). In simple terms, this ETF is an income-generating spin on Strategy (NASDAQ: MSTR), the largest corporate owner of Bitcoin.
Where to invest $1,000 right now? Our analyst team just revealed what they believe are the 10 best stocks to buy right now. Continue »

There are better ways to play crypto and generate income than this ETF. Image source: Getty Images.
Neither Strategy nor Bitcoin pays dividends, so, understandably, some investors are tempted by this ETF's staggering distribution rate of 75.1% (as of Jan. 21). The Strategy income ETF is home to $1.44 billion in assets under management, making it the fourth-largest single-stock ETF.
Platitudes aside, a strong case can be made that this ETF isn't for every investor, even the most income-enthused, because its "plumbing" can prove problematic.
A risky income ETF
Spend enough time analyzing and investing in ETFs, and investors are apt to hear phrases like "under the hood" and "methodology matters." Overused as they may be, those adages are highly relevant in discussing this YieldMax ETF.
In essence, this fund is a covered call product, meaning it sells call options (and uses other options strategies) on shares of Strategy. The trade-off for the income served up by this and other covered call ETFs is that investors' upside exposure is capped. This ETF's issuer says as much. Limited upside explains why the fund hasn't been as responsive to Bitcoin's and Strategy's appreciation as investors would like.
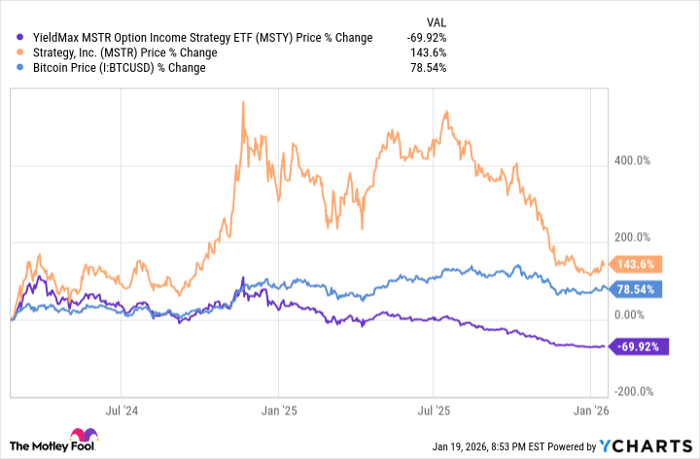
MSTY data by YCharts
That's not the end of the strikes against this ETF. Perhaps even more critical than the capped upside is the fact that the Strategy ETF doesn't deliver dividend income in the manner to which many market participants are accustomed. In fact, this ETF doesn't pay dividends. It delivers distributions.
That difference is material because dividends are paid from company profits, whereas distributions are a return of capital (ROC) and generated income. The capital being returned by this ETF and others like it is the cash investors allocate to these funds. Specific to the Strategy income ETF, 94.7% of its most recent distribution was ROC. Said another way, for every dollar invested, shareholders were getting 94.7 cents of their own money back.
No free lunches here
The biggest issue with this isn't the difference between dividends and distributions, but the problems those differences create. Qualified dividends are taxed at up to 20%, but the premiums collected by the Strategy ETF can be taxed at as much as 37%. So from a tax perspective, many investors are better off with traditional dividend stocks and ETFs.
Alone, higher taxes could prompt some market participants to stay away from this ETF, and if that doesn't do the trick, net asset value (NAV) erosion may. Because this ETF is returning so much of investors' capital, its NAV grinds lower over time. Not only does that cap upside, but it can also lead to ominous scenarios such as reverse splits. Large yield or not, this ETF's cons may outweigh its pros in the eyes of many investors.
Should you buy stock in Tidal Trust II - YieldMaxTM Mstr Option Income Strategy ETF right now?
Before you buy stock in Tidal Trust II - YieldMaxTM Mstr Option Income Strategy ETF, consider this:
The Motley Fool Stock Advisor analyst team just identified what they believe are the 10 best stocks for investors to buy now… and Tidal Trust II - YieldMaxTM Mstr Option Income Strategy ETF wasn’t one of them. The 10 stocks that made the cut could produce monster returns in the coming years.
Consider when Netflix made this list on December 17, 2004... if you invested $1,000 at the time of our recommendation, you’d have $462,174!* Or when Nvidia made this list on April 15, 2005... if you invested $1,000 at the time of our recommendation, you’d have $1,143,099!*
Now, it’s worth noting Stock Advisor’s total average return is 946% — a market-crushing outperformance compared to 196% for the S&P 500. Don't miss the latest top 10 list, available with Stock Advisor, and join an investing community built by individual investors for individual investors.
See the 10 stocks »
*Stock Advisor returns as of January 27, 2026.
Todd Shriber has no position in any of the stocks mentioned. The Motley Fool has positions in and recommends Bitcoin. The Motley Fool has a disclosure policy.
Recommended Articles


