


The Best Index Funds to Buy: Low Cost IVV or Higher Yield DIA?
Key Points
DIA holds just 30 blue-chip stocks while IVV captures the full S&P 500 universe.
DIA charges a higher expense ratio but delivers a slightly higher yield than IVV.
IVV has outperformed DIA over the past year and five-year period, with deeper technology exposure.
- These 10 stocks could mint the next wave of millionaires ›
The iShares Core S&P 500 ETF (NYSEMKT:IVV) and SPDR Dow Jones Industrial Average ETF Trust (NYSEMKT:DIA) differ sharply in cost, portfolio makeup, and diversification, with IVV offering broader coverage and lower fees while DIA focuses on 30 blue-chip names and a modestly higher yield.
IVV aims to mirror the S&P 500, providing exposure to a wide swath of large-cap U.S. equities, while DIA tracks the Dow Jones Industrial Average, a price-weighted collection of 30 established blue-chip companies. This comparison highlights how these two stalwarts stack up on cost, performance, risk, and portfolio composition for investors considering core U.S. equity exposure.
Snapshot (cost & size)
| Metric | IVV | DIA |
|---|---|---|
| Issuer | IShares | SPDR |
| Expense ratio | 0.03% | 0.16% |
| 1-yr total return (as of 2026-01-26) | 15.4% | 13% |
| Dividend yield | 1.05% | 1.4% |
| Beta | 1.00 | 0.89 |
| AUM | $763 billion | $44.1 billion |
Beta measures price volatility relative to the S&P 500; beta is calculated from five-year weekly returns. The 1-yr return represents total return over the trailing 12 months.
IVV looks more affordable with a much lower expense ratio, while DIA pays a modestly higher yield. The cost difference may matter to fee-conscious investors, but DIA’s slightly higher payout could appeal to those prioritizing income.
Performance & risk comparison
| Metric | IVV | DIA |
|---|---|---|
| Max drawdown (5 y) | -27.67% | -43.43% |
| Growth of $1,000 over 5 years | $1,814 | $1,582 |
What's inside
DIA tracks the Dow Jones Industrial Average and holds just 30 stocks, emphasizing financial services (27.5%), technology (18.9%), and industrials (15.8%). Its top positions include Goldman Sachs Group (NYSE:GS) at 11.61%, Caterpillar (NYSE:CAT) at 7.92%, and Microsoft (NASDAQ:MSFT) at 5.86%. The fund has a 28-year track record, and its compact portfolio results in heavier weightings in each constituent relative to broader funds.
IVV, by contrast, offers exposure to the full S&P 500 index, with a heavy tilt toward technology (33.65%), followed by financial services (12.8%), communication (10.67%), and consumer cyclicals (10.5%). Top holdings include Nvidia (NASDAQ:NVDA), Apple (NASDAQ:AAPL), and Microsoft, each representing a smaller slice of the portfolio. This broader approach means IVV captures a much wider cross-section of the U.S. equity market.
For more guidance on ETF investing, check out the full guide at this link.
What this means for investors
The iShares Core S&P 500 ETF and the SPDR Dow Jones Industrial Average ETF Trust are two of the best index funds, offering investors two ways to invest in the broader U.S. stock market.
The major difference lies in the size of exposure, with IVV tracking the 500 largest U.S. stocks by market capitalization versus the DIA, which tracks only 30 blue-chip stocks. That also explains why the DIA is so much more volatile, as reflected by the maximum drawdowns of the two ETFs. Because the DIA is such a heavily concentrated fund, one stock’s swings can affect the entire fund significantly than a single stock would in IVV.
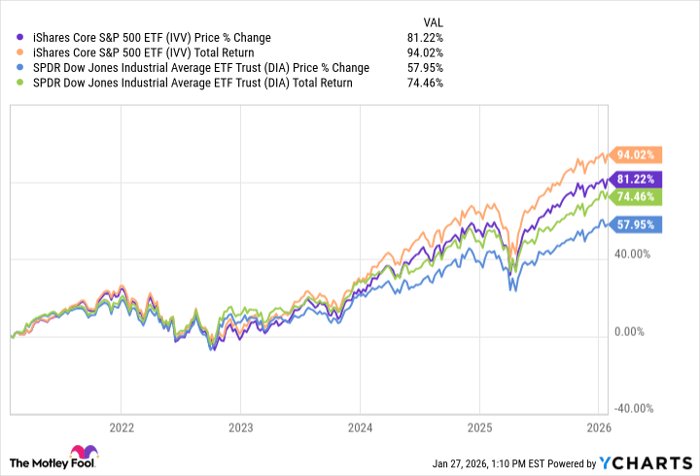
IVV data by YCharts
DIA, therefore, is a perfect choice for investors looking to invest in blue chip stocks, or shares of well-established, high-quality companies that are also often industry leaders. Blue chip companies are also often steady and stable dividend payers, making this ETF a solid choice for income investors.
IVV, on the other hand, can be considered a gold standard for tracking the U.S. stock market in the long term, as the S&P 500 index serves as a barometer of the U.S. economy and the stock market. IVV is also cheaper and less volatile than DIA, thanks to its diversification.
Glossary
ETF (Exchange-traded fund): A fund holding a basket of securities that trades on an exchange like a stock.
Expense ratio: Annual fund operating costs expressed as a percentage of the amount you invest.
Dividend yield: Annual dividends paid by a fund divided by its current share price, shown as a percentage.
Total return: Investment performance including price changes plus all dividends, assuming dividends are reinvested.
Beta: A measure of how volatile an investment is compared with a benchmark index, usually the S&P 500.
AUM (Assets under management): The total market value of all assets a fund or manager oversees.
Max drawdown: The largest peak-to-trough decline in value over a specific period, showing worst historical loss.
Price-weighted index: An index where companies with higher share prices have greater influence on index performance.
Blue-chip stocks: Shares of large, well-established, financially sound companies with long records of stable performance.
Sector allocation: How a fund’s holdings are distributed across different industries, such as technology or financials.
Core U.S. equity exposure: Foundational stock holdings intended to represent the broad U.S. stock market in a portfolio.
Portfolio diversification: Spreading investments across many holdings or sectors to reduce the impact of any single position.
Where to invest $1,000 right now
When our analyst team has a stock tip, it can pay to listen. After all, Stock Advisor’s total average return is 946%* — a market-crushing outperformance compared to 196% for the S&P 500.
They just revealed what they believe are the 10 best stocks for investors to buy right now, available when you join Stock Advisor.
See the stocks »
*Stock Advisor returns as of January 27, 2026.
Neha Chamaria has no position in any of the stocks mentioned. The Motley Fool has positions in and recommends Apple, Caterpillar, Goldman Sachs Group, Microsoft, and Nvidia. The Motley Fool has a disclosure policy.
Recommended Articles


