
The Stock Market Is Doing Something Witnessed Only 2 Times in 153 Years -- and History Is Very Clear About What Happens in the New Year.
Key Points
The S&P 500 has climbed in the double digits in each of the past three years.
Investors have piled into growth stocks and have favored those in innovative fields such as AI and quantum computing.
- 10 stocks we like better than S&P 500 Index ›
The stock market has had quite a run over the past three years. It roared into bull territory, and that momentum has continued, with the S&P 500 delivering annual gains of 24%, 23%, and 16%, respectively. Artificial intelligence (AI) stocks, quantum computing players, and other growth companies have led the movement -- for a couple of reasons. Investors, seeing the potential of these exciting technologies, have aimed to get in on future leaders early in the story. That way, they may maximize their gains as developments unfold.
Investors also have liked the idea that we're heading into a lower interest rate environment. The Federal Reserve began cutting rates in 2024 and continued to do so last year. A lower rate environment is positive for companies as it reduces their borrowing costs, making it easier for them to grow. And it also offers relief to consumers' wallets -- and that's great news for consumer-related businesses.
Where to invest $1,000 right now? Our analyst team just revealed what they believe are the 10 best stocks to buy right now, when you join Stock Advisor. See the stocks »
Now, as we start off a new year, investors are wondering what's next for stocks. Will the market continue to soar in 2026? It's a great idea to zoom in on the market and consider the current picture closely. And when we do this, we can see that the stock market is doing something witnessed only twice in 153 years. And history is very clear about what may happen in the new year.

Image source: Getty Images.
Last year's headwinds
So, first, it's important to note that the stock market's path throughout this bull market hasn't been one straight line upward. Various elements have interrupted the action here and there. Last year, for example, President Donald Trump's plan to launch import tariffs weighed on the S&P 500 as investors worried about the impact on corporate earnings. Some U.S. companies, like Apple, produce their goods in other countries and must import them, while others, such as Target, source certain products internationally. They would bear the costs of the new tariffs.
But stocks quickly rebounded. Trump's negotiations with countries, various exceptions made for certain industries, and corporate earnings reports that showed continued growth offered investors reason to be optimistic.
The market also slid later in the year amid concern about the possibility of an AI bubble emerging. Again, investors quickly regained confidence as they focused on the high levels of demand for AI products and solid earnings reports from AI giants such as Nvidia and Advanced Micro Devices.
A rare move for the S&P 500
Market optimism has outweighed any of the potential problems, and that has driven the market to do something rarely seen in all of its history. This has to do with the S&P 500 Shiller CAPE ratio, a measure of valuation using stock prices and earnings per share. The measure is particularly accurate because it considers earnings over a decade, accounting for any shifts in economic conditions.
And this measure is telling us that stocks are at one of their most expensive levels ever. The Shiller CAPE ratio has reached 39, a level it only reached once before -- during the dot-com boom.
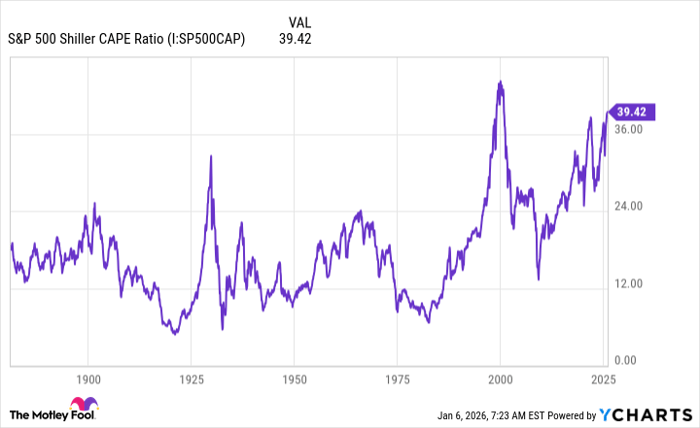
S&P 500 Shiller CAPE Ratio data by YCharts
What's next for the market? A look at history shows us that following peaks in valuation levels, the S&P 500 has declined.
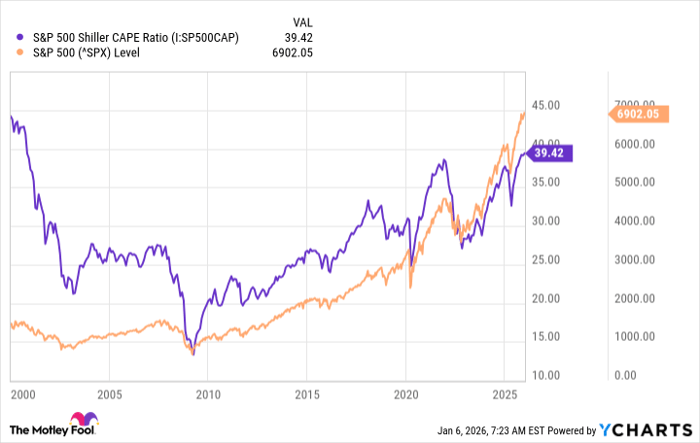
S&P 500 Shiller CAPE Ratio data by YCharts
And from early 2000, when the dot-com bubble started to deflate, through February 2003, the S&P 500 lost more than 40%.
So, the evidence is strikingly clear: When valuations soar, the index eventually will slip. This means we could be heading for a decline in 2026 -- but the good news is this doesn't necessarily mean a full-year or more in negative territory. The S&P 500 is likely to pull back at some point, if history is right, but this movement may be brief, lasting a few weeks or even a month or two. And the benchmark still could finish 2026 with a gain.
What does this mean for investors? It's important to pay attention to valuations and avoid buying stocks that are too expensive. But when the price is right, keep investing in quality players and plan on holding onto them for the long haul. With this strategy in place, you may score an investing victory over time -- even if the market slips at some point in 2026.
Should you buy stock in S&P 500 Index right now?
Before you buy stock in S&P 500 Index, consider this:
The Motley Fool Stock Advisor analyst team just identified what they believe are the 10 best stocks for investors to buy now… and S&P 500 Index wasn’t one of them. The 10 stocks that made the cut could produce monster returns in the coming years.
Consider when Netflix made this list on December 17, 2004... if you invested $1,000 at the time of our recommendation, you’d have $482,326!* Or when Nvidia made this list on April 15, 2005... if you invested $1,000 at the time of our recommendation, you’d have $1,133,015!*
Now, it’s worth noting Stock Advisor’s total average return is 968% — a market-crushing outperformance compared to 197% for the S&P 500. Don't miss the latest top 10 list, available with Stock Advisor, and join an investing community built by individual investors for individual investors.
See the 10 stocks »
*Stock Advisor returns as of January 11, 2026.
Adria Cimino has positions in Target. The Motley Fool has positions in and recommends Advanced Micro Devices, Apple, Nvidia, and Target. The Motley Fool has a disclosure policy.
Recommended Articles


