Is Palantir the Next Tesla?

Source The Motley Fool

Key Points

  • Tesla and Palantir both have low institutional ownership figures.

  • The rise of retail investing provides another force that can influence stocks.

  • 10 stocks we like better than Palantir Technologies ›

Few stocks have been called overvalued and a scam as much as Tesla (NASDAQ: TSLA) has. However, the returns keep coming, and long-term shareholders have been rewarded, even if it hasn't been the smoothest of rides.

Part of the reason for Tesla's stock success is the loyalty of retail investors who don't think about cash flows or valuation, instead buying the stocks they feel can succeed. Part of the reason for Tesla's success is its CEO, Elon Musk. Whether you like him or not, it doesn't matter. The reality is, his leadership created a strong following in Tesla's stock, and his vision for the future captured the imagination of shareholders.

Where to invest $1,000 right now? Our analyst team just revealed what they believe are the 10 best stocks to buy right now, when you join Stock Advisor. See the stocks »

While Tesla has faced several sell-offs and calls for it to be worth far less than it actually is (there's still an analyst who has a $120 price target on Tesla's stock, according to Yahoo! Finance), it has maintained its elevated levels for a long time and has bounced back after each sell-off. With the rise of retail investors, stocks that defy logic have become a trend, and I think it could be a similar story with Palantir (NASDAQ: PLTR).

Palantir's valuation metrics do not make any sense either, and its large individual ownership percentage could be a reason why Palantir is slated to become the next Tesla.

Tech engineers huddled around a computer.

Image source: Getty Images.

Palantir's AI software is making a huge difference

Palantir makes artificial intelligence (AI)-powered data analytics software that was originally intended for government use. Eventually, it found a use case in the commercial markets and saw impressive growth there, too.

In recent years, the biggest reason Palantir has grown so much is its Artificial Intelligence Platform (AIP) product. AIP allows clients to integrate generative AI agents into workflows. These agents can be fully autonomous or require approval for tasks after doing work that humans normally do.

Palantir's growth has been nothing short of incredible, and its third quarter was no exception. Commercial revenue rose 73% year over year to $548 million, and government revenue increased at a 55% pace to $633 million. That led to an overall growth rate of 63% to $1.18 billion for the quarter. It also delivered an impressive profit margin of 40%, showcasing that Palantir isn't trading profitability for growth.

Both Palantir's story and growth make it look like an incredible investment pick, but there's just one problem: valuation.

Palantir's valuation is unbelievable

Palantir is among the most expensive stocks in the market, trading for 123 times sales and 259 times forward earnings.

PLTR PS Ratio Chart

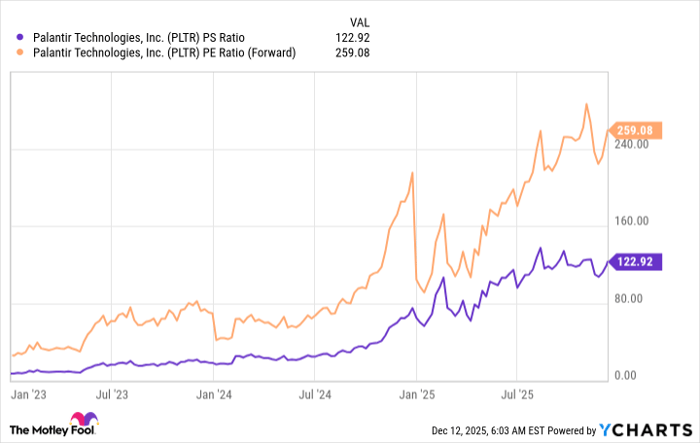
PLTR PS Ratio data by YCharts

It's rare to see a company trade at that much of a premium, especially compared to some of its AI peers. Take Nvidia, for example. In its most recent quarter, revenue grew at a 62% pace (nearly the same as Palantir), and its profit margin was 56% (much higher than Palantir's). Nvidia's expected revenue growth rate for next year is 48%, while Palantir's is 41%. So, Nvidia is the better business by nearly every metric. However, its stock trades for 24 times sales and 39 times forward earnings.

That means that for Palantir to reach Nvidia's valuation level, its finances must increase by over fivefold while its stock price stays flat. That doesn't make any sense and leads many in the market to call it overvalued. That isn't far off from where Tesla has been over the past five years, as many have called its valuation unreasonable, but its stock never faded to the point where anyone would call it reasonably valued.

This can be explained by its low percentage of institutional ownership, which in turn means a high percentage of individual investor ownership. About 48.1% of Tesla shares are owned by institutional investors. Other companies similar to Tesla's size are Meta Platforms and Berkshire Hathaway. These two have institutional ownership of 77.4% and 65.7%, respectively. That's a noticeably higher percentage than Tesla, and shows that individual investors drive Tesla's stock.

Palantir is in a similar boat. Institutional investors own 56.5% of shares, and similarly sized companies like AMD and Mastercard have 65.4% and 90% ownership by institutional investors.

As a result, Palantir's stock may not be able to be valued by usual valuation metrics, which could be a problem for some investors. Additionally, shorting the stock or other actions may not work either. Instead, if you feel like Palantir is overvalued and a bubble waiting to pop, stay away from it. I'm in that boat, as the valuation doesn't make sense, but fighting the trend against individual investors in Tesla stock hasn't worked, and it may not work with Palantir's stock, either.

Should you buy stock in Palantir Technologies right now?

Before you buy stock in Palantir Technologies, consider this:

The Motley Fool Stock Advisor analyst team just identified what they believe are the 10 best stocks for investors to buy now… and Palantir Technologies wasn’t one of them. The 10 stocks that made the cut could produce monster returns in the coming years.

Consider when Netflix made this list on December 17, 2004... if you invested $1,000 at the time of our recommendation, you’d have $509,955!* Or when Nvidia made this list on April 15, 2005... if you invested $1,000 at the time of our recommendation, you’d have $1,089,460!*

Now, it’s worth noting Stock Advisor’s total average return is 968% — a market-crushing outperformance compared to 193% for the S&P 500. Don't miss the latest top 10 list, available with Stock Advisor, and join an investing community built by individual investors for individual investors.

See the 10 stocks »

*Stock Advisor returns as of December 18, 2025.

Keithen Drury has positions in Mastercard, Meta Platforms, Nvidia, and Tesla. The Motley Fool has positions in and recommends Advanced Micro Devices, Berkshire Hathaway, Mastercard, Meta Platforms, Nvidia, Palantir Technologies, and Tesla. The Motley Fool has a disclosure policy.

Disclaimer: For information purposes only. Past performance is not indicative of future results.
placeholder
Ethereum Price Slips Lower — $3,000 Looms as the Key BattlegroundEthereum is attempting to recover from a $3,026 low but remains below $3,200 and the 100-hour SMA, with a bearish trend line near $3,175 capping rebounds as bulls need a clean break above $3,200 to target $3,250–$3,400, while a drop below $3,050 risks a retest of $3,000 and $2,940.
Author  Mitrade
Dec 15, Mon
Ethereum is attempting to recover from a $3,026 low but remains below $3,200 and the 100-hour SMA, with a bearish trend line near $3,175 capping rebounds as bulls need a clean break above $3,200 to target $3,250–$3,400, while a drop below $3,050 risks a retest of $3,000 and $2,940.
placeholder
Bitcoin Slides 5% as Sellers Lean In — Can BTC Reclaim $88,000?Bitcoin has dropped back below $88,000 after rolling over from $90,500, with price still trading under the 100-hour Simple Moving Average. The sell-off found a floor at $85,151, and BTC is now consolidating near that base, but rebounds are facing pressure from a bearish trend line around $89,000. Bulls need to retake $88,000–$89,000 to ease downside risk; failure to do so keeps $85,500–$85,000 and then $83,500 in play, with $80,000 as the deeper “line in the sand.” Bitcoin (BTC) is back in damage-control mode after a sharp pullback wiped out recent gains. The price failed to reclaim the $90,000–$90,500 band, rolled over, and slid through $88,500 before briefly dipping under $87,000. Buyers did show up around $85,000, but the rebound so far looks more like stabilization than a clear trend reversal. Bitcoin dips hard, finds a bid near $85,000(h3) BTC’s latest move lower began when it couldn’t build follow-through above $90,000 and $90,500. Once that upside stalled, sellers took control and pushed price down through $88,500. The slide accelerated enough to spike below $87,000, but the market didn’t free-fall. Bulls defended the $85,000 zone, printing a low at $85,151. Since then, Bitcoin has been consolidating below the 23.6% Fibonacci retracement of the drop from the $93,560 swing high to the $85,151 low — a clue that the bounce is still shallow and that sellers haven’t fully backed off yet. Structurally, BTC is still on the back foot: It’s trading below $88,000, and It remains below the 100-hour Simple Moving Average, keeping short-term trend pressure pointed downward. Resistance is layered, and $89,000 is the problem area(h3) If bulls try to turn this into a recovery, they’ll have to climb through multiple ceilings in quick succession. First, BTC faces resistance around $87,150, followed by a more meaningful barrier near $87,500. From there, the market’s attention snaps back to $88,000 — the level BTC just lost and now needs to reclaim. A close back above $88,000 would improve the tone, but it doesn’t solve the bigger issue: there’s a bearish trend line on the hourly BTC/USD chart (Kraken feed) with resistance near $89,000, which also lines up with the next technical hurdle. If BTC can push through $89,000 and hold, the rebound could extend toward $90,000, with follow-through targets at $91,000 and $91,500. But until price clears that $88,000–$89,000 zone, rallies are at risk of being sold rather than chased. If BTC fails to reclaim resistance, the downside path is clear(h3) The near-term bear case is simple: if Bitcoin can’t climb back above the $87,000 area and keep traction, sellers may attempt another leg lower. Support levels line up like this: Immediate support: $85,500 First major support: $85,000 Next support: $83,500 Then $82,500 in the near term Below that, the major “don’t break this” level is still $80,000. If BTC slips under $80,000, the risk of acceleration to the downside increases significantly — not because it’s magic, but because it’s the kind of psychological and structural level that tends to trigger forced de-risking. Indicators: momentum still leans bearish(h3) The intraday indicators aren’t offering much comfort yet: Hourly MACD is losing pace in the bearish zone. Hourly RSI remains below 50, suggesting sellers still have the upper hand on short timeframes. So while the $85,000 defense held for now, the market hasn’t flipped bullish — it’s just stopped bleeding.
Author  Mitrade
Dec 16, Tue
Bitcoin has dropped back below $88,000 after rolling over from $90,500, with price still trading under the 100-hour Simple Moving Average. The sell-off found a floor at $85,151, and BTC is now consolidating near that base, but rebounds are facing pressure from a bearish trend line around $89,000. Bulls need to retake $88,000–$89,000 to ease downside risk; failure to do so keeps $85,500–$85,000 and then $83,500 in play, with $80,000 as the deeper “line in the sand.” Bitcoin (BTC) is back in damage-control mode after a sharp pullback wiped out recent gains. The price failed to reclaim the $90,000–$90,500 band, rolled over, and slid through $88,500 before briefly dipping under $87,000. Buyers did show up around $85,000, but the rebound so far looks more like stabilization than a clear trend reversal. Bitcoin dips hard, finds a bid near $85,000(h3) BTC’s latest move lower began when it couldn’t build follow-through above $90,000 and $90,500. Once that upside stalled, sellers took control and pushed price down through $88,500. The slide accelerated enough to spike below $87,000, but the market didn’t free-fall. Bulls defended the $85,000 zone, printing a low at $85,151. Since then, Bitcoin has been consolidating below the 23.6% Fibonacci retracement of the drop from the $93,560 swing high to the $85,151 low — a clue that the bounce is still shallow and that sellers haven’t fully backed off yet. Structurally, BTC is still on the back foot: It’s trading below $88,000, and It remains below the 100-hour Simple Moving Average, keeping short-term trend pressure pointed downward. Resistance is layered, and $89,000 is the problem area(h3) If bulls try to turn this into a recovery, they’ll have to climb through multiple ceilings in quick succession. First, BTC faces resistance around $87,150, followed by a more meaningful barrier near $87,500. From there, the market’s attention snaps back to $88,000 — the level BTC just lost and now needs to reclaim. A close back above $88,000 would improve the tone, but it doesn’t solve the bigger issue: there’s a bearish trend line on the hourly BTC/USD chart (Kraken feed) with resistance near $89,000, which also lines up with the next technical hurdle. If BTC can push through $89,000 and hold, the rebound could extend toward $90,000, with follow-through targets at $91,000 and $91,500. But until price clears that $88,000–$89,000 zone, rallies are at risk of being sold rather than chased. If BTC fails to reclaim resistance, the downside path is clear(h3) The near-term bear case is simple: if Bitcoin can’t climb back above the $87,000 area and keep traction, sellers may attempt another leg lower. Support levels line up like this: Immediate support: $85,500 First major support: $85,000 Next support: $83,500 Then $82,500 in the near term Below that, the major “don’t break this” level is still $80,000. If BTC slips under $80,000, the risk of acceleration to the downside increases significantly — not because it’s magic, but because it’s the kind of psychological and structural level that tends to trigger forced de-risking. Indicators: momentum still leans bearish(h3) The intraday indicators aren’t offering much comfort yet: Hourly MACD is losing pace in the bearish zone. Hourly RSI remains below 50, suggesting sellers still have the upper hand on short timeframes. So while the $85,000 defense held for now, the market hasn’t flipped bullish — it’s just stopped bleeding.
placeholder
December Santa Claus Rally: New highs in sight for US and European stocks?Historical data show a rising trend of US and European stocks in December. If the momentum is strong, fund managers may rush in with a buying frenzy.
Author  Mitrade
Yesterday 02: 50
Historical data show a rising trend of US and European stocks in December. If the momentum is strong, fund managers may rush in with a buying frenzy.
placeholder
XRP’s Price Action Flashes a Warning Even as ETF Flows Stay PositiveXRP’s structure remains weak despite 18 straight positive closes in spot XRP ETFs, with analysts warning that $1.98 and other nearby resistance zones could cap rebounds unless the YO region is reclaimed, while deeper downside scenarios keep $1.53 on watch as a potential (not guaranteed) accumulation area.
Author  Mitrade
Yesterday 06: 37
XRP’s structure remains weak despite 18 straight positive closes in spot XRP ETFs, with analysts warning that $1.98 and other nearby resistance zones could cap rebounds unless the YO region is reclaimed, while deeper downside scenarios keep $1.53 on watch as a potential (not guaranteed) accumulation area.
placeholder
Gold declines on profit-taking, USD strength ahead of US CPI releaseGold price (XAU/USD) edges lower below $4,350 during the Asian trading hours on Thursday. The precious metal retreats from seven-week highs amid some profit-taking and a rebound in the US Dollar (USD).
Author  FXStreet
4 hours ago
Gold price (XAU/USD) edges lower below $4,350 during the Asian trading hours on Thursday. The precious metal retreats from seven-week highs amid some profit-taking and a rebound in the US Dollar (USD).
goTop
quote