
2 Dirt Cheap Stocks to Buy With $1,000 Right Now
Key Points
Netflix and Fiverr look dirt cheap -- but not based on simple valuation ratios like P/E or price-to-sales.
The bullish case depends on growth and cash generation.
Solid sales and careening cash flows meet sinking stocks, and the market should fix that misunderstanding someday.
- 10 stocks we like better than Netflix ›
Fiverr International (NYSE: FVRR) and Netflix (NASDAQ: NFLX) may not appear dirt cheap at first glance. The world's largest media-streaming company trades at 39 times trailing earnings (P/E) and 9.9 times sales as of Dec. 15, 2025. The freelance services wrangler's shares carry a 34 P/E ratio. That's hardly bargain-bin material, right?
But things look different in a certain slant of light. In my eyes, both Netflix and Fiverr are top-notch growth stocks on fire sale. If you have $1,000 to invest today, you should start your stock-picking hunt with these two names.
Where to invest $1,000 right now? Our analyst team just revealed what they believe are the 10 best stocks to buy right now. Continue »
Let me show you why.

Image source: Getty Images.
Yes, I said "dirt cheap"
First and foremost, those valuation ratios alone can't tell the whole story. Investors often give fast-growing companies a richer valuation, because they expect today's rising business to generate much larger profits and cash flows in the future.
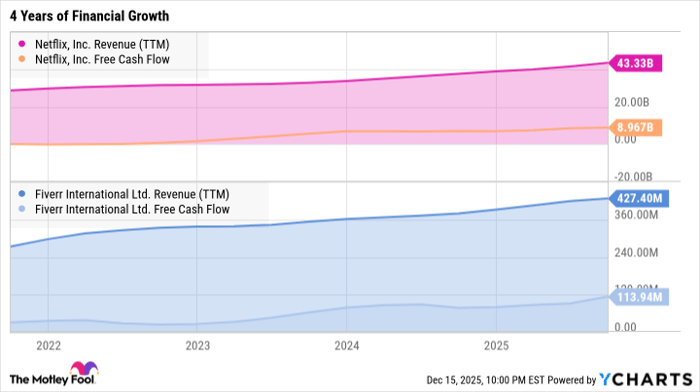
NFLX Revenue (TTM) data by YCharts
Those lines may feel flat, but that's just a trick of the light. Both companies experienced annual revenue growth of roughly 15% in this four-year span, while their free cash flows skyrocketed:
NFLX Revenue (TTM) data by YCharts
For those keeping score at home, Fiverr's trailing twelve-month free cash flows rose from $32 million to $114 million. Netflix's cash profits soared from $126 million to $9.0 billion.
I'm not sure about you, but these growth rates are worth above-average stock prices to me. And you may have noticed that I started those charts in the fall of 2021 -- at the tail end of the coronavirus lockdown era, where many investors expected companies like Netflix and Fiverr to fall out of favor.
As you can see, they turned out to be something more than the pure-play COVID-19 winners you saw in 2020 and 2021.
Wall Street expects more growth ahead (grain of salt included)
Fiverr and Netflix are expected to keep their double-digit revenue growth going for the foreseeable future. According to analyst polls by Standard & Poor's Global Intelligence, Fiverr's average annual growth over the next five years should be roughly 14.1%. For Netflix, the average 5-year growth rate projection is 11.5%.
The same group expects Netflix's free cash flows to increase by approximately 21% per year until 2030. Fiverr seems to be standing at the very threshold of accelerated profits, since its cash flows should more than double over each of the next five years.
Analyst projections are not the same thing as "tomorrow's newspaper today," especially not five years into the future. I'm just saying that Wall Street's pros see something happening here, and agree wholeheartedly.
Two different moats, one discount in common
Netflix is no longer a speculative disruptor but a global, cash-gushing streaming entertainment leader. The streaming dominator has plenty of untapped viewing-share runway and new growth levers up its sleeves.
Fiverr is a beaten-down, cash-generating freelance marketplace. The market is mispricing it, overstating the threat of artificial intelligence (AI) and underestimating the long-term value of AI-assisted human expertise.
These companies are treading new ground in their respective fields of expertise. Fiverr explicitly wants to change how business gets done on a global scale. Netflix isn't stating its goals in that type of world-changing words, but has literally been rewriting Hollywood's rulebook for two decades now.
I could also remind you that Netflix's stock is down 30% from June's all-time high of $134 per share. Fiverr's shares have trended lower over the last five years (even though the business continued to grow), including a 43% drop over the last year.
Whether you focus on long-term growth targets, proven financial strength, recent price drops, or modest valuation multiples, you can't go far wrong with Fiverr or Netflix right now. These companies and stocks tick every box on my checklist.
Should you buy stock in Netflix right now?
Before you buy stock in Netflix, consider this:
The Motley Fool Stock Advisor analyst team just identified what they believe are the 10 best stocks for investors to buy now… and Netflix wasn’t one of them. The 10 stocks that made the cut could produce monster returns in the coming years.
Consider when Netflix made this list on December 17, 2004... if you invested $1,000 at the time of our recommendation, you’d have $509,955!* Or when Nvidia made this list on April 15, 2005... if you invested $1,000 at the time of our recommendation, you’d have $1,089,460!*
Now, it’s worth noting Stock Advisor’s total average return is 968% — a market-crushing outperformance compared to 193% for the S&P 500. Don't miss the latest top 10 list, available with Stock Advisor, and join an investing community built by individual investors for individual investors.
See the 10 stocks »
*Stock Advisor returns as of December 17, 2025.
Anders Bylund has positions in Fiverr International and Netflix. The Motley Fool has positions in and recommends Fiverr International and Netflix. The Motley Fool has a disclosure policy.
Recommended Articles


