Will There Be a Santa Claus Rally in the Stock Market This Year?

Source The Motley Fool

Key Points

  • Sometimes stocks experience outsize upward movements during the final trading days of the year, known as a Santa Claus rally.

  • Investing in the S&P 500 is a proven winning investment decision whether or not a Santa Claus rally materializes.

  • 10 stocks we like better than S&P 500 Index ›

It's that time of year when Mariah Carey and Michael Bublé come out of hibernation as their Christmas hits loop endlessly on the airwaves at malls and department stores. Children are anxiously anticipating presents under the tree, while ever-growing shopping lists make your Black Friday receipts look reasonable.

Kids and parents aren't the only ones hoping Saint Nick comes down their chimney this holiday season, though. Each year, investors also brace for whether Santa put them on the naughty or nice list.

Where to invest $1,000 right now? Our analyst team just revealed what they believe are the 10 best stocks to buy right now, when you join Stock Advisor. See the stocks »

Let's explore a common stock market phenomenon known as the Santa Claus rally. Below, investors will learn what this event entails and how often they occur. From there, we'll be able to better understand which direction your portfolio may be headed going into the new year.

A person celebrating at their desk while wearing a Santa Claus hat.

Image source: Getty Images.

What is a Santa Claus rally and what causes it?

A Santa Claus rally is a cute way of referring to some extra gains in the stock market toward the end of the year. In other words, sometimes stocks generate abnormally high returns as the calendar year comes to a close. The window constituting a Santa Claus rally occurs between the last five trading days of December and the first two of January.

You may be wondering what actually causes stocks to rally during these final trading sessions. While there is not a single catalyst that ignites a Santa Claus rally, a number of ingredients typically come to together at the end of the year that can inspire outsize movement in stocks.

For instance, institutional investors generally take vacation -- or at the very least, work far less hours than usual -- during the last week of the year. As a result, capital inflows from hedge funds and investment banks generally drop compared to their average levels. This means that trading volume becomes thinner, which in turn makes it easier for retail investors to inspire short-term run-ups in stocks.

Another big factor that can determine whether or not an end-of-year rally occurs is tax loss harvesting. This is a fancy financial jargon term that simply means some investors sell poor-performing stocks at a loss in order to offset the capital gains tax liability from their winning investments. As such, other investors swoop in and buy the dip -- pushing stocks higher after their brief sell-off.

Other variables in the Santa Claus rally equation include people spending their Christmas bonuses as well as buying into the idea that if a rally occurred last year, then one must happen again this year. Ultimately, Santa Claus rallies come together through a combination of certain market fundamentals and investor psychology.

Santa Claus smiling.

Image source: Getty Images.

How often do Santa Claus rallies happen?

The term "Santa Claus rally" was first cited in Yale Hirsch's 1972 publication of The Stock Trader's Almanac. Going back to 1950, however, the S&P 500 (SNPINDEX: ^GSPC) has posted positive returns during the Santa Claus rally period almost 80% of the time -- with the average gain being 1.3%.

According to research from LPL Financial, consecutive years of negative returns during the Santa Claus rally period have only occurred between 1993-1994 and 2015-2016.

Will there be a Santa Claus rally in 2025?

In 2024, the S&P 500 posted an annual gain of 23% -- marking the second year in a row of gains north of 20%. Notably, however, a Santa Claus rally did not occur last year as heavy sell-offs plagued the market between Christmas and New Year's.

Given the details explored above, it would seem likely that a rally is in store for investors in 2025. With that said, history is no guarantee of future performance in the stock market.

Moreover, smart investors know better than to try to time the market. In my eyes, whether a Santa Claus rally comes to fruition this year or not is fairly irrelevant.
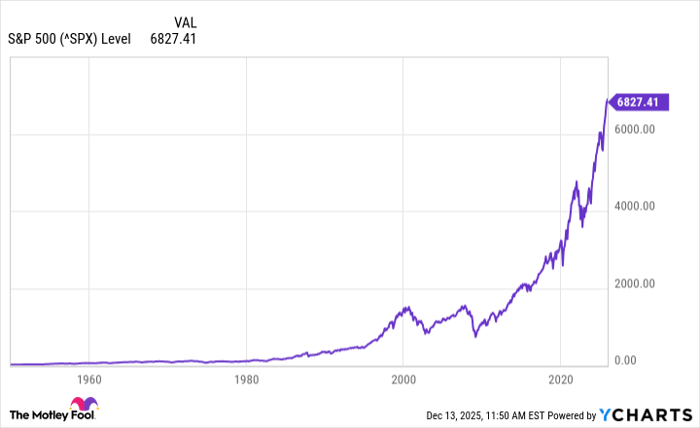
^SPX Chart

Data by YCharts

As the chart above illustrates, whether you invest in the S&P 500 at all-time highs or choose to capitalize on corrections, buying the index and holding for the long run has proven to be a wise decision.

To me, investors shouldn't try to time specific market movements in an effort to ride momentum into the new year. Rather, I'd encourage investors to use the final weeks of the year to do an inventory check on their portfolio and potentially trim their laggards and double down on their winners.

As 2026 approaches, further gains in the S&P 500 look likely -- whether Saint Nick makes an appearance or not.

Should you buy stock in S&P 500 Index right now?

Before you buy stock in S&P 500 Index, consider this:

The Motley Fool Stock Advisor analyst team just identified what they believe are the 10 best stocks for investors to buy now… and S&P 500 Index wasn’t one of them. The 10 stocks that made the cut could produce monster returns in the coming years.

Consider when Netflix made this list on December 17, 2004... if you invested $1,000 at the time of our recommendation, you’d have $505,695!* Or when Nvidia made this list on April 15, 2005... if you invested $1,000 at the time of our recommendation, you’d have $1,080,694!*

Now, it’s worth noting Stock Advisor’s total average return is 962% — a market-crushing outperformance compared to 193% for the S&P 500. Don't miss the latest top 10 list, available with Stock Advisor, and join an investing community built by individual investors for individual investors.

See the 10 stocks »

*Stock Advisor returns as of December 16, 2025.

Adam Spatacco has no position in any of the stocks mentioned. The Motley Fool has no position in any of the stocks mentioned. The Motley Fool has a disclosure policy.

Disclaimer: For information purposes only. Past performance is not indicative of future results.
placeholder
U.S. November Nonfarm Payrolls: What Does the Rare "Weak Jobs, Strong Economy" Mix Mean for U.S. Equities?1. IntroductionAfter retreating from the late-October highs, U.S. equities embarked on a bottoming rebound in mid-to-late November, a trend driven by the interplay of multiple factors. That said, it i
Author  TradingKey
11 hours ago
1. IntroductionAfter retreating from the late-October highs, U.S. equities embarked on a bottoming rebound in mid-to-late November, a trend driven by the interplay of multiple factors. That said, it i
placeholder
Senate Delays Crypto Market Structure Hearings to Early 2026The Senate Banking Committee has postponed cryptocurrency market structure hearings until 2026, citing ongoing bipartisan negotiations.
Author  Mitrade
16 hours ago
The Senate Banking Committee has postponed cryptocurrency market structure hearings until 2026, citing ongoing bipartisan negotiations.
placeholder
Bitcoin Slides 5% as Sellers Lean In — Can BTC Reclaim $88,000?Bitcoin has dropped back below $88,000 after rolling over from $90,500, with price still trading under the 100-hour Simple Moving Average. The sell-off found a floor at $85,151, and BTC is now consolidating near that base, but rebounds are facing pressure from a bearish trend line around $89,000. Bulls need to retake $88,000–$89,000 to ease downside risk; failure to do so keeps $85,500–$85,000 and then $83,500 in play, with $80,000 as the deeper “line in the sand.” Bitcoin (BTC) is back in damage-control mode after a sharp pullback wiped out recent gains. The price failed to reclaim the $90,000–$90,500 band, rolled over, and slid through $88,500 before briefly dipping under $87,000. Buyers did show up around $85,000, but the rebound so far looks more like stabilization than a clear trend reversal. Bitcoin dips hard, finds a bid near $85,000(h3) BTC’s latest move lower began when it couldn’t build follow-through above $90,000 and $90,500. Once that upside stalled, sellers took control and pushed price down through $88,500. The slide accelerated enough to spike below $87,000, but the market didn’t free-fall. Bulls defended the $85,000 zone, printing a low at $85,151. Since then, Bitcoin has been consolidating below the 23.6% Fibonacci retracement of the drop from the $93,560 swing high to the $85,151 low — a clue that the bounce is still shallow and that sellers haven’t fully backed off yet. Structurally, BTC is still on the back foot: It’s trading below $88,000, and It remains below the 100-hour Simple Moving Average, keeping short-term trend pressure pointed downward. Resistance is layered, and $89,000 is the problem area(h3) If bulls try to turn this into a recovery, they’ll have to climb through multiple ceilings in quick succession. First, BTC faces resistance around $87,150, followed by a more meaningful barrier near $87,500. From there, the market’s attention snaps back to $88,000 — the level BTC just lost and now needs to reclaim. A close back above $88,000 would improve the tone, but it doesn’t solve the bigger issue: there’s a bearish trend line on the hourly BTC/USD chart (Kraken feed) with resistance near $89,000, which also lines up with the next technical hurdle. If BTC can push through $89,000 and hold, the rebound could extend toward $90,000, with follow-through targets at $91,000 and $91,500. But until price clears that $88,000–$89,000 zone, rallies are at risk of being sold rather than chased. If BTC fails to reclaim resistance, the downside path is clear(h3) The near-term bear case is simple: if Bitcoin can’t climb back above the $87,000 area and keep traction, sellers may attempt another leg lower. Support levels line up like this: Immediate support: $85,500 First major support: $85,000 Next support: $83,500 Then $82,500 in the near term Below that, the major “don’t break this” level is still $80,000. If BTC slips under $80,000, the risk of acceleration to the downside increases significantly — not because it’s magic, but because it’s the kind of psychological and structural level that tends to trigger forced de-risking. Indicators: momentum still leans bearish(h3) The intraday indicators aren’t offering much comfort yet: Hourly MACD is losing pace in the bearish zone. Hourly RSI remains below 50, suggesting sellers still have the upper hand on short timeframes. So while the $85,000 defense held for now, the market hasn’t flipped bullish — it’s just stopped bleeding.
Author  Mitrade
19 hours ago
Bitcoin has dropped back below $88,000 after rolling over from $90,500, with price still trading under the 100-hour Simple Moving Average. The sell-off found a floor at $85,151, and BTC is now consolidating near that base, but rebounds are facing pressure from a bearish trend line around $89,000. Bulls need to retake $88,000–$89,000 to ease downside risk; failure to do so keeps $85,500–$85,000 and then $83,500 in play, with $80,000 as the deeper “line in the sand.” Bitcoin (BTC) is back in damage-control mode after a sharp pullback wiped out recent gains. The price failed to reclaim the $90,000–$90,500 band, rolled over, and slid through $88,500 before briefly dipping under $87,000. Buyers did show up around $85,000, but the rebound so far looks more like stabilization than a clear trend reversal. Bitcoin dips hard, finds a bid near $85,000(h3) BTC’s latest move lower began when it couldn’t build follow-through above $90,000 and $90,500. Once that upside stalled, sellers took control and pushed price down through $88,500. The slide accelerated enough to spike below $87,000, but the market didn’t free-fall. Bulls defended the $85,000 zone, printing a low at $85,151. Since then, Bitcoin has been consolidating below the 23.6% Fibonacci retracement of the drop from the $93,560 swing high to the $85,151 low — a clue that the bounce is still shallow and that sellers haven’t fully backed off yet. Structurally, BTC is still on the back foot: It’s trading below $88,000, and It remains below the 100-hour Simple Moving Average, keeping short-term trend pressure pointed downward. Resistance is layered, and $89,000 is the problem area(h3) If bulls try to turn this into a recovery, they’ll have to climb through multiple ceilings in quick succession. First, BTC faces resistance around $87,150, followed by a more meaningful barrier near $87,500. From there, the market’s attention snaps back to $88,000 — the level BTC just lost and now needs to reclaim. A close back above $88,000 would improve the tone, but it doesn’t solve the bigger issue: there’s a bearish trend line on the hourly BTC/USD chart (Kraken feed) with resistance near $89,000, which also lines up with the next technical hurdle. If BTC can push through $89,000 and hold, the rebound could extend toward $90,000, with follow-through targets at $91,000 and $91,500. But until price clears that $88,000–$89,000 zone, rallies are at risk of being sold rather than chased. If BTC fails to reclaim resistance, the downside path is clear(h3) The near-term bear case is simple: if Bitcoin can’t climb back above the $87,000 area and keep traction, sellers may attempt another leg lower. Support levels line up like this: Immediate support: $85,500 First major support: $85,000 Next support: $83,500 Then $82,500 in the near term Below that, the major “don’t break this” level is still $80,000. If BTC slips under $80,000, the risk of acceleration to the downside increases significantly — not because it’s magic, but because it’s the kind of psychological and structural level that tends to trigger forced de-risking. Indicators: momentum still leans bearish(h3) The intraday indicators aren’t offering much comfort yet: Hourly MACD is losing pace in the bearish zone. Hourly RSI remains below 50, suggesting sellers still have the upper hand on short timeframes. So while the $85,000 defense held for now, the market hasn’t flipped bullish — it’s just stopped bleeding.
placeholder
AUD/USD remains depressed below mid-0.6600s; downside seems limited ahead of US NFP reportThe AUD/USD pair attracts some sellers for the fourth straight day on Tuesday and trades around the 0.6630 region, down just over 0.10%, during the Asian session.
Author  FXStreet
20 hours ago
The AUD/USD pair attracts some sellers for the fourth straight day on Tuesday and trades around the 0.6630 region, down just over 0.10%, during the Asian session.
placeholder
Macro Analysts: Hawkish Japan Could Push Bitcoin Below $70KAnalysts predict Bitcoin may face further declines towards the $70,000 mark if the Bank of Japan raises interest rates as expected.
Author  Mitrade
Yesterday 05: 48
Analysts predict Bitcoin may face further declines towards the $70,000 mark if the Bank of Japan raises interest rates as expected.
goTop
quote