As Warren Buffett Prepares to Step Down as CEO of Berkshire Hathaway, His Parting Message to Investors Couldn't Be Any More Clear

Source The Motley Fool

Key Points

  • Warren Buffett has led Berkshire Hathaway for six decades.

  • Berkshire's portfolio activity was limited during the third quarter.

  • It holds a record level of cash as Buffett prepares to step down as CEO.

  • 10 stocks we like better than Berkshire Hathaway ›

Back in May, Warren Buffett sent shockwaves around the investment world after announcing he was stepping down as CEO of his investment conglomerate, Berkshire Hathaway (NYSE: BRK.A) (NYSE: BRK.B).

Ever since this decision became public knowledge, investors have watched Berkshire's moves with an extra level of vigilance. As 2026 approaches and longtime Buffett sidekick Greg Abel prepares to take the reins at Berkshire, I can't help but notice some patterns in the firm's recent portfolio management.

Where to invest $1,000 right now? Our analyst team just revealed what they believe are the 10 best stocks to buy right now, when you join Stock Advisor. See the stocks »

Let's take a look at Berkshire's recent moves to better understand Buffett's parting message as this chapter of his investment career comes to a close.

Warren Buffett giving a speech at a shareholder meeting.

Image source: The Motley Fool.

What stocks did Warren Buffett buy last quarter?

According to Berkshire's latest 13F filing, Buffett's largest purchase last quarter to his existing portfolio allocations was a stake in the casualty insurance broker Chubb. During the third quarter, Berkshire scooped up 4.3 million shares of Chubb stock -- increasing its stake by 16%.

In addition to insurance, Buffett also doubled down on the American consumer through purchases of Domino's Pizza and Sirius XM. Lastly, some of the smaller moves Berkshire made included additional purchases of shares in Lamar Advertising and the homebuilding company Lennar.

Perhaps the biggest move Berkshire made during Q3 was its decision to initiate a position in Alphabet -- acquiring 17.8 million shares that are currently valued at $4.3 billion.

Google logo on phone wallpaper.

Image source: Getty Images.

Berkshire's balance sheet is in a solid position for the post-Buffett era

Given the details above, it might look like Berkshire was on a buying spree last quarter. However, Buffett's other moves prove that quite the opposite is taking shape over at Berkshire.

The investment firm has continued to trim exposure to core positions across Apple and Bank of America. Meanwhile, Berkshire completely sold out of Citigroup and T-Mobile US earlier this year.

BRK.B Cash and Short Term Investments (Quarterly) Chart

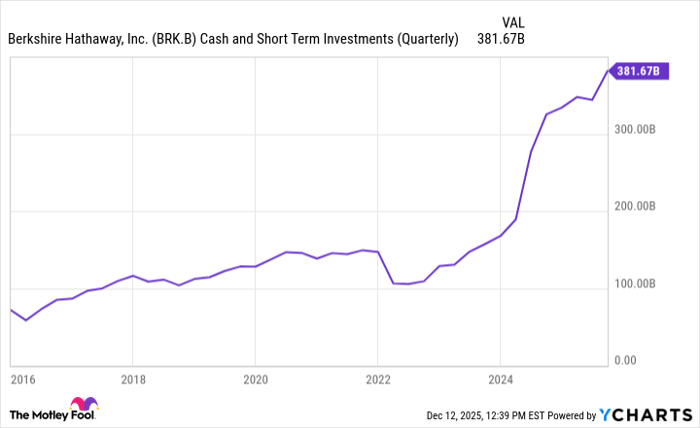
BRK.B Cash and Short Term Investments (Quarterly) data by YCharts

Against this backdrop, Berkshire's balance sheet reported a record $381.7 billion in cash and short-term investments at the end of the third quarter. Of note, the short-term investments comprise purchases of U.S. Treasury Bills.

As the graph above illustrates, Berkshire has been stockpiling cash for the last couple of years, suggesting that buying activity at the firm has been quite limited.

What do these moves suggest Buffett is thinking?

For nearly sixty years, Buffett's investment philosophy has rested on a few central ideas. First, Buffett is a contrarian -- he does not chase hype or follow narrative-driven premiums. With this in mind, the Oracle of Omaha is always looking for a good deal -- especially during frothy market conditions.

In addition, Buffett is a fan of letting your money work for you. Coined the snowball effect, Buffett's strategy of reinvesting dividends and earning interest on cash has proven to be a lucrative mechanism for growing modest sums into generational wealth.

In the analysis above, investors can see that Berkshire didn't do anything completely out of the ordinary during the third quarter. The company doubled down on consumer and insurance businesses -- two hallmarks of its portfolio since its early days.

Furthermore, Berkshire continued to act prudently -- taking gains off the table in core positions and rotating capital into opportunities that may be seen as a better value right now.

At the end of the day, I don't think Buffett has changed his thinking at all. Why would he? With cumulative annual returns of 20% since the 1960s, Buffett's methods clearly work.

One psychological aspect of investing that Buffett has mastered is his refusal to allow emotions to dictate his investment decisions. For six decades, he has remained unapologetically steadfast and focused on the long term. In the process, he built one of the most respected diversified portfolios of the modern era -- beating the S&P 500 consistently over the course of many years.

As Buffett bids farewell to the limelight, I think Berkshire's moves during the third quarter carry the same messages he's always tried to instill: Take gains when appropriate, identify value where you can, always bet on American resilience, complement your stocks with some cash, and let compound interest do work for you in the background.

By employing these strategies, patient and disciplined investors should help earn healthy returns on their capital as Buffett has masterfully done throughout his accomplished career.

Should you buy stock in Berkshire Hathaway right now?

Before you buy stock in Berkshire Hathaway, consider this:

The Motley Fool Stock Advisor analyst team just identified what they believe are the 10 best stocks for investors to buy now… and Berkshire Hathaway wasn’t one of them. The 10 stocks that made the cut could produce monster returns in the coming years.

Consider when Netflix made this list on December 17, 2004... if you invested $1,000 at the time of our recommendation, you’d have $505,695!* Or when Nvidia made this list on April 15, 2005... if you invested $1,000 at the time of our recommendation, you’d have $1,080,694!*

Now, it’s worth noting Stock Advisor’s total average return is 962% — a market-crushing outperformance compared to 193% for the S&P 500. Don't miss the latest top 10 list, available with Stock Advisor, and join an investing community built by individual investors for individual investors.

See the 10 stocks »

*Stock Advisor returns as of December 16, 2025.

Citigroup is an advertising partner of Motley Fool Money. Bank of America is an advertising partner of Motley Fool Money. Adam Spatacco has positions in Alphabet and Apple. The Motley Fool has positions in and recommends Alphabet, Apple, Berkshire Hathaway, Domino's Pizza, and Lennar. The Motley Fool recommends T-Mobile US. The Motley Fool has a disclosure policy.

Disclaimer: For information purposes only. Past performance is not indicative of future results.
placeholder
U.S. November Nonfarm Payrolls: What Does the Rare "Weak Jobs, Strong Economy" Mix Mean for U.S. Equities?1. IntroductionAfter retreating from the late-October highs, U.S. equities embarked on a bottoming rebound in mid-to-late November, a trend driven by the interplay of multiple factors. That said, it i
Author  TradingKey
8 hours ago
1. IntroductionAfter retreating from the late-October highs, U.S. equities embarked on a bottoming rebound in mid-to-late November, a trend driven by the interplay of multiple factors. That said, it i
placeholder
Senate Delays Crypto Market Structure Hearings to Early 2026The Senate Banking Committee has postponed cryptocurrency market structure hearings until 2026, citing ongoing bipartisan negotiations.
Author  Mitrade
12 hours ago
The Senate Banking Committee has postponed cryptocurrency market structure hearings until 2026, citing ongoing bipartisan negotiations.
placeholder
Bitcoin Slides 5% as Sellers Lean In — Can BTC Reclaim $88,000?Bitcoin has dropped back below $88,000 after rolling over from $90,500, with price still trading under the 100-hour Simple Moving Average. The sell-off found a floor at $85,151, and BTC is now consolidating near that base, but rebounds are facing pressure from a bearish trend line around $89,000. Bulls need to retake $88,000–$89,000 to ease downside risk; failure to do so keeps $85,500–$85,000 and then $83,500 in play, with $80,000 as the deeper “line in the sand.” Bitcoin (BTC) is back in damage-control mode after a sharp pullback wiped out recent gains. The price failed to reclaim the $90,000–$90,500 band, rolled over, and slid through $88,500 before briefly dipping under $87,000. Buyers did show up around $85,000, but the rebound so far looks more like stabilization than a clear trend reversal. Bitcoin dips hard, finds a bid near $85,000(h3) BTC’s latest move lower began when it couldn’t build follow-through above $90,000 and $90,500. Once that upside stalled, sellers took control and pushed price down through $88,500. The slide accelerated enough to spike below $87,000, but the market didn’t free-fall. Bulls defended the $85,000 zone, printing a low at $85,151. Since then, Bitcoin has been consolidating below the 23.6% Fibonacci retracement of the drop from the $93,560 swing high to the $85,151 low — a clue that the bounce is still shallow and that sellers haven’t fully backed off yet. Structurally, BTC is still on the back foot: It’s trading below $88,000, and It remains below the 100-hour Simple Moving Average, keeping short-term trend pressure pointed downward. Resistance is layered, and $89,000 is the problem area(h3) If bulls try to turn this into a recovery, they’ll have to climb through multiple ceilings in quick succession. First, BTC faces resistance around $87,150, followed by a more meaningful barrier near $87,500. From there, the market’s attention snaps back to $88,000 — the level BTC just lost and now needs to reclaim. A close back above $88,000 would improve the tone, but it doesn’t solve the bigger issue: there’s a bearish trend line on the hourly BTC/USD chart (Kraken feed) with resistance near $89,000, which also lines up with the next technical hurdle. If BTC can push through $89,000 and hold, the rebound could extend toward $90,000, with follow-through targets at $91,000 and $91,500. But until price clears that $88,000–$89,000 zone, rallies are at risk of being sold rather than chased. If BTC fails to reclaim resistance, the downside path is clear(h3) The near-term bear case is simple: if Bitcoin can’t climb back above the $87,000 area and keep traction, sellers may attempt another leg lower. Support levels line up like this: Immediate support: $85,500 First major support: $85,000 Next support: $83,500 Then $82,500 in the near term Below that, the major “don’t break this” level is still $80,000. If BTC slips under $80,000, the risk of acceleration to the downside increases significantly — not because it’s magic, but because it’s the kind of psychological and structural level that tends to trigger forced de-risking. Indicators: momentum still leans bearish(h3) The intraday indicators aren’t offering much comfort yet: Hourly MACD is losing pace in the bearish zone. Hourly RSI remains below 50, suggesting sellers still have the upper hand on short timeframes. So while the $85,000 defense held for now, the market hasn’t flipped bullish — it’s just stopped bleeding.
Author  Mitrade
15 hours ago
Bitcoin has dropped back below $88,000 after rolling over from $90,500, with price still trading under the 100-hour Simple Moving Average. The sell-off found a floor at $85,151, and BTC is now consolidating near that base, but rebounds are facing pressure from a bearish trend line around $89,000. Bulls need to retake $88,000–$89,000 to ease downside risk; failure to do so keeps $85,500–$85,000 and then $83,500 in play, with $80,000 as the deeper “line in the sand.” Bitcoin (BTC) is back in damage-control mode after a sharp pullback wiped out recent gains. The price failed to reclaim the $90,000–$90,500 band, rolled over, and slid through $88,500 before briefly dipping under $87,000. Buyers did show up around $85,000, but the rebound so far looks more like stabilization than a clear trend reversal. Bitcoin dips hard, finds a bid near $85,000(h3) BTC’s latest move lower began when it couldn’t build follow-through above $90,000 and $90,500. Once that upside stalled, sellers took control and pushed price down through $88,500. The slide accelerated enough to spike below $87,000, but the market didn’t free-fall. Bulls defended the $85,000 zone, printing a low at $85,151. Since then, Bitcoin has been consolidating below the 23.6% Fibonacci retracement of the drop from the $93,560 swing high to the $85,151 low — a clue that the bounce is still shallow and that sellers haven’t fully backed off yet. Structurally, BTC is still on the back foot: It’s trading below $88,000, and It remains below the 100-hour Simple Moving Average, keeping short-term trend pressure pointed downward. Resistance is layered, and $89,000 is the problem area(h3) If bulls try to turn this into a recovery, they’ll have to climb through multiple ceilings in quick succession. First, BTC faces resistance around $87,150, followed by a more meaningful barrier near $87,500. From there, the market’s attention snaps back to $88,000 — the level BTC just lost and now needs to reclaim. A close back above $88,000 would improve the tone, but it doesn’t solve the bigger issue: there’s a bearish trend line on the hourly BTC/USD chart (Kraken feed) with resistance near $89,000, which also lines up with the next technical hurdle. If BTC can push through $89,000 and hold, the rebound could extend toward $90,000, with follow-through targets at $91,000 and $91,500. But until price clears that $88,000–$89,000 zone, rallies are at risk of being sold rather than chased. If BTC fails to reclaim resistance, the downside path is clear(h3) The near-term bear case is simple: if Bitcoin can’t climb back above the $87,000 area and keep traction, sellers may attempt another leg lower. Support levels line up like this: Immediate support: $85,500 First major support: $85,000 Next support: $83,500 Then $82,500 in the near term Below that, the major “don’t break this” level is still $80,000. If BTC slips under $80,000, the risk of acceleration to the downside increases significantly — not because it’s magic, but because it’s the kind of psychological and structural level that tends to trigger forced de-risking. Indicators: momentum still leans bearish(h3) The intraday indicators aren’t offering much comfort yet: Hourly MACD is losing pace in the bearish zone. Hourly RSI remains below 50, suggesting sellers still have the upper hand on short timeframes. So while the $85,000 defense held for now, the market hasn’t flipped bullish — it’s just stopped bleeding.
placeholder
AUD/USD remains depressed below mid-0.6600s; downside seems limited ahead of US NFP reportThe AUD/USD pair attracts some sellers for the fourth straight day on Tuesday and trades around the 0.6630 region, down just over 0.10%, during the Asian session.
Author  FXStreet
17 hours ago
The AUD/USD pair attracts some sellers for the fourth straight day on Tuesday and trades around the 0.6630 region, down just over 0.10%, during the Asian session.
placeholder
Macro Analysts: Hawkish Japan Could Push Bitcoin Below $70KAnalysts predict Bitcoin may face further declines towards the $70,000 mark if the Bank of Japan raises interest rates as expected.
Author  Mitrade
Yesterday 05: 48
Analysts predict Bitcoin may face further declines towards the $70,000 mark if the Bank of Japan raises interest rates as expected.
goTop
quote