Is This ETF the Best Way to Invest in the S&P 500 in 2026?

Source The Motley Fool

Key Points

  • The S&P 500 is at its most expensive level since the dot-com bubble.

  • Nvidia, Apple, and Microsoft account for nearly 22% of this index.

  • An equal-weight S&P 500 ETF avoids this heavy concentration in tech.

  • 10 stocks we like better than Invesco S&P 500 Equal Weight ETF ›

The S&P 500 (SNPINDEX: ^GSPC) is arguably the stock market's most important index. Tracking around 500 of the largest American companies on the market, it has long been a way that people get a peek into the health of the U.S. economy (though the two are not directly tied).

After slipping into a brief correction amid the Trump administration's tariff plan in April, the S&P 500 has bounced back impressively. Through Dec. 12, the index is up over 17% year to date.

Where to invest $1,000 right now? Our analyst team just revealed what they believe are the 10 best stocks to buy right now, when you join Stock Advisor. See the stocks »

On one hand, I'm sure investors appreciate the run the S&P 500 is on. On the other hand, it has brought on new risks related to the index's valuation and the composition of its holdings. Given those risks, is now the time to consider an alternate way to invest in the S&P 500? Let's take a look.

S&P 500 letters in front of stacked bars with red and green arrows.

Image source: Getty Images.

Just how expensive is the current S&P 500?

The S&P 500's level alone isn't a way to gauge how expensive or inexpensive it is. A common approach is to look at the Shiller price-to-earnings (P/E) ratio, sometimes known as the CAPE ratio. This metric examines the S&P 500's inflation-adjusted earnings per share (EPS) over the past 10 years, aiming to provide insight into the index's valuation without being influenced by one-off events that can be misleading.

At the time of this writing, the Shiller P/E ratio is 40.6, a level it has hit once before. And unfortunately, the last time resulted in the dot-com crash. Of course, past performance doesn't guarantee future performance, but it makes sense that the correlation would prompt some investors' caution.

An entire index led by a handful of companies

Another issue with the current S&P 500 is how top-heavy it has become since larger companies account for more of the index than smaller ones. That has caused large tech stocks to be heavily represented. Based on the Vanguard S&P 500 ETF, here are the index's top 10 holdings:

Company Percentage of the ETF
Nvidia 8.46%
Apple 6.87%
Microsoft 6.59%
Amazon 4.06%
Broadcom 2.98%
Alphabet (both classes) 5.05%
Meta Platforms 2.41%
Tesla 2.19%
Berkshire Hathaway (class B) 1.50%

Source: Vanguard. Percentages as of Oct. 31.

The S&P 500 is supposed to represent the broader U.S. economy -- which it still does to a certain extent -- but having 10 companies account for over 40% of the index isn't ideal from a diversification standpoint. This is especially true when the top three holdings themselves account for nearly 22%.

Consider this alternative way to invest in the S&P 500

One way to get exposure to S&P 500 companies without taking on the risks of the current S&P 500 is by investing in an equal-weight S&P 500 ETF like the Invesco S&P 500 Equal Weight ETF (NYSEMKT: RSP). While the standard S&P 500 gives more weight to larger companies, RSP assigns every company roughly the same weight.

Below is how the standard S&P 500's top holdings are represented in RSP:

Company Percentage of the ETF
Nvidia 0.20%
Apple 0.24%
Microsoft 0.19%
Amazon 0.19%
Broadcom 0.21%
Alphabet(both classes) 0.25%
Meta Platforms 0.17%
Tesla 0.25%
Berkshire Hathaway (class B) 0.19%

Source: Invesco. Percentages as of Dec. 11.

RSP gives you exposure to the same 500-ish companies without your gains relying so heavily on the "Magnificent Seven" stocks. This high concentration of the standard S&P 500 has worked out in its favor over the past decade, outperforming RSP by 242% to 157%. However, when you zoom out, RSP has slightly outperformed the standard S&P 500 since its April 2003 inception.
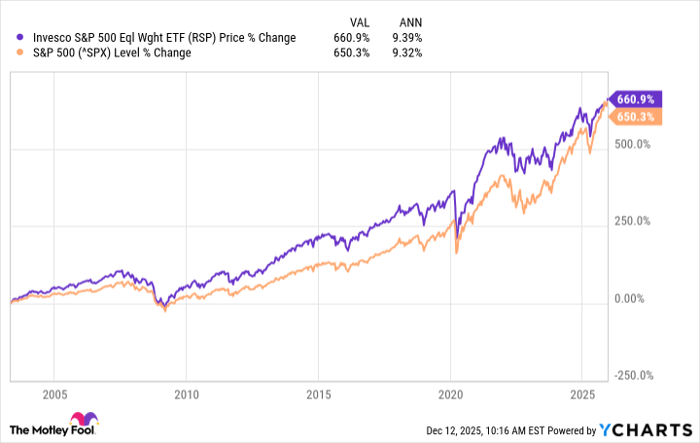
RSP Chart

RSP data by YCharts

I'm still an avid standard S&P 500 investor (the Vanguard S&P 500 ETF is my top holding), but RSP stands out as a way to hedge against some of the risks the current S&P 500 presents while still giving you exposure to some of the world's top companies.

Should you buy stock in Invesco S&P 500 Equal Weight ETF right now?

Before you buy stock in Invesco S&P 500 Equal Weight ETF, consider this:

The Motley Fool Stock Advisor analyst team just identified what they believe are the 10 best stocks for investors to buy now… and Invesco S&P 500 Equal Weight ETF wasn’t one of them. The 10 stocks that made the cut could produce monster returns in the coming years.

Consider when Netflix made this list on December 17, 2004... if you invested $1,000 at the time of our recommendation, you’d have $505,695!* Or when Nvidia made this list on April 15, 2005... if you invested $1,000 at the time of our recommendation, you’d have $1,080,694!*

Now, it’s worth noting Stock Advisor’s total average return is 962% — a market-crushing outperformance compared to 193% for the S&P 500. Don't miss the latest top 10 list, available with Stock Advisor, and join an investing community built by individual investors for individual investors.

See the 10 stocks »

*Stock Advisor returns as of December 16, 2025.

Stefon Walters has positions in Apple and Microsoft. The Motley Fool has positions in and recommends Alphabet, Amazon, Apple, Berkshire Hathaway, Meta Platforms, Microsoft, Nvidia, and Tesla. The Motley Fool recommends Broadcom and recommends the following options: long January 2026 $395 calls on Microsoft and short January 2026 $405 calls on Microsoft. The Motley Fool has a disclosure policy.

Disclaimer: For information purposes only. Past performance is not indicative of future results.
placeholder
U.S. November Nonfarm Payrolls: What Does the Rare "Weak Jobs, Strong Economy" Mix Mean for U.S. Equities?1. IntroductionAfter retreating from the late-October highs, U.S. equities embarked on a bottoming rebound in mid-to-late November, a trend driven by the interplay of multiple factors. That said, it i
Author  TradingKey
6 hours ago
1. IntroductionAfter retreating from the late-October highs, U.S. equities embarked on a bottoming rebound in mid-to-late November, a trend driven by the interplay of multiple factors. That said, it i
placeholder
Senate Delays Crypto Market Structure Hearings to Early 2026The Senate Banking Committee has postponed cryptocurrency market structure hearings until 2026, citing ongoing bipartisan negotiations.
Author  Mitrade
11 hours ago
The Senate Banking Committee has postponed cryptocurrency market structure hearings until 2026, citing ongoing bipartisan negotiations.
placeholder
Bitcoin Slides 5% as Sellers Lean In — Can BTC Reclaim $88,000?Bitcoin has dropped back below $88,000 after rolling over from $90,500, with price still trading under the 100-hour Simple Moving Average. The sell-off found a floor at $85,151, and BTC is now consolidating near that base, but rebounds are facing pressure from a bearish trend line around $89,000. Bulls need to retake $88,000–$89,000 to ease downside risk; failure to do so keeps $85,500–$85,000 and then $83,500 in play, with $80,000 as the deeper “line in the sand.” Bitcoin (BTC) is back in damage-control mode after a sharp pullback wiped out recent gains. The price failed to reclaim the $90,000–$90,500 band, rolled over, and slid through $88,500 before briefly dipping under $87,000. Buyers did show up around $85,000, but the rebound so far looks more like stabilization than a clear trend reversal. Bitcoin dips hard, finds a bid near $85,000(h3) BTC’s latest move lower began when it couldn’t build follow-through above $90,000 and $90,500. Once that upside stalled, sellers took control and pushed price down through $88,500. The slide accelerated enough to spike below $87,000, but the market didn’t free-fall. Bulls defended the $85,000 zone, printing a low at $85,151. Since then, Bitcoin has been consolidating below the 23.6% Fibonacci retracement of the drop from the $93,560 swing high to the $85,151 low — a clue that the bounce is still shallow and that sellers haven’t fully backed off yet. Structurally, BTC is still on the back foot: It’s trading below $88,000, and It remains below the 100-hour Simple Moving Average, keeping short-term trend pressure pointed downward. Resistance is layered, and $89,000 is the problem area(h3) If bulls try to turn this into a recovery, they’ll have to climb through multiple ceilings in quick succession. First, BTC faces resistance around $87,150, followed by a more meaningful barrier near $87,500. From there, the market’s attention snaps back to $88,000 — the level BTC just lost and now needs to reclaim. A close back above $88,000 would improve the tone, but it doesn’t solve the bigger issue: there’s a bearish trend line on the hourly BTC/USD chart (Kraken feed) with resistance near $89,000, which also lines up with the next technical hurdle. If BTC can push through $89,000 and hold, the rebound could extend toward $90,000, with follow-through targets at $91,000 and $91,500. But until price clears that $88,000–$89,000 zone, rallies are at risk of being sold rather than chased. If BTC fails to reclaim resistance, the downside path is clear(h3) The near-term bear case is simple: if Bitcoin can’t climb back above the $87,000 area and keep traction, sellers may attempt another leg lower. Support levels line up like this: Immediate support: $85,500 First major support: $85,000 Next support: $83,500 Then $82,500 in the near term Below that, the major “don’t break this” level is still $80,000. If BTC slips under $80,000, the risk of acceleration to the downside increases significantly — not because it’s magic, but because it’s the kind of psychological and structural level that tends to trigger forced de-risking. Indicators: momentum still leans bearish(h3) The intraday indicators aren’t offering much comfort yet: Hourly MACD is losing pace in the bearish zone. Hourly RSI remains below 50, suggesting sellers still have the upper hand on short timeframes. So while the $85,000 defense held for now, the market hasn’t flipped bullish — it’s just stopped bleeding.
Author  Mitrade
14 hours ago
Bitcoin has dropped back below $88,000 after rolling over from $90,500, with price still trading under the 100-hour Simple Moving Average. The sell-off found a floor at $85,151, and BTC is now consolidating near that base, but rebounds are facing pressure from a bearish trend line around $89,000. Bulls need to retake $88,000–$89,000 to ease downside risk; failure to do so keeps $85,500–$85,000 and then $83,500 in play, with $80,000 as the deeper “line in the sand.” Bitcoin (BTC) is back in damage-control mode after a sharp pullback wiped out recent gains. The price failed to reclaim the $90,000–$90,500 band, rolled over, and slid through $88,500 before briefly dipping under $87,000. Buyers did show up around $85,000, but the rebound so far looks more like stabilization than a clear trend reversal. Bitcoin dips hard, finds a bid near $85,000(h3) BTC’s latest move lower began when it couldn’t build follow-through above $90,000 and $90,500. Once that upside stalled, sellers took control and pushed price down through $88,500. The slide accelerated enough to spike below $87,000, but the market didn’t free-fall. Bulls defended the $85,000 zone, printing a low at $85,151. Since then, Bitcoin has been consolidating below the 23.6% Fibonacci retracement of the drop from the $93,560 swing high to the $85,151 low — a clue that the bounce is still shallow and that sellers haven’t fully backed off yet. Structurally, BTC is still on the back foot: It’s trading below $88,000, and It remains below the 100-hour Simple Moving Average, keeping short-term trend pressure pointed downward. Resistance is layered, and $89,000 is the problem area(h3) If bulls try to turn this into a recovery, they’ll have to climb through multiple ceilings in quick succession. First, BTC faces resistance around $87,150, followed by a more meaningful barrier near $87,500. From there, the market’s attention snaps back to $88,000 — the level BTC just lost and now needs to reclaim. A close back above $88,000 would improve the tone, but it doesn’t solve the bigger issue: there’s a bearish trend line on the hourly BTC/USD chart (Kraken feed) with resistance near $89,000, which also lines up with the next technical hurdle. If BTC can push through $89,000 and hold, the rebound could extend toward $90,000, with follow-through targets at $91,000 and $91,500. But until price clears that $88,000–$89,000 zone, rallies are at risk of being sold rather than chased. If BTC fails to reclaim resistance, the downside path is clear(h3) The near-term bear case is simple: if Bitcoin can’t climb back above the $87,000 area and keep traction, sellers may attempt another leg lower. Support levels line up like this: Immediate support: $85,500 First major support: $85,000 Next support: $83,500 Then $82,500 in the near term Below that, the major “don’t break this” level is still $80,000. If BTC slips under $80,000, the risk of acceleration to the downside increases significantly — not because it’s magic, but because it’s the kind of psychological and structural level that tends to trigger forced de-risking. Indicators: momentum still leans bearish(h3) The intraday indicators aren’t offering much comfort yet: Hourly MACD is losing pace in the bearish zone. Hourly RSI remains below 50, suggesting sellers still have the upper hand on short timeframes. So while the $85,000 defense held for now, the market hasn’t flipped bullish — it’s just stopped bleeding.
placeholder
AUD/USD remains depressed below mid-0.6600s; downside seems limited ahead of US NFP reportThe AUD/USD pair attracts some sellers for the fourth straight day on Tuesday and trades around the 0.6630 region, down just over 0.10%, during the Asian session.
Author  FXStreet
15 hours ago
The AUD/USD pair attracts some sellers for the fourth straight day on Tuesday and trades around the 0.6630 region, down just over 0.10%, during the Asian session.
placeholder
Macro Analysts: Hawkish Japan Could Push Bitcoin Below $70KAnalysts predict Bitcoin may face further declines towards the $70,000 mark if the Bank of Japan raises interest rates as expected.
Author  Mitrade
Yesterday 05: 48
Analysts predict Bitcoin may face further declines towards the $70,000 mark if the Bank of Japan raises interest rates as expected.
goTop
quote