All It Takes Is $6,500 Invested in Coca-Cola and This High-Yield Dividend Stock to Help Generate $539 in Passive Income in 2026

Source The Motley Fool

Key Points

  • Stocks that pay dividends offer a means to participate in the market while boosting your passive income stream.

  • Coke continues to grow earnings and free cash flow to support future dividend raises.

  • Campbell’s dividend yield has skyrocketed as its stock price has plummeted.

  • 10 stocks we like better than Coca-Cola ›

Where to invest $1,000 right now? Our analyst team just revealed what they believe are the 10 best stocks to buy right now. Continue »

Stocks are often classified as either growth, value, or a combination of the two.

Value stocks can be viewed as mature businesses with steady earnings, whereas growth stocks are valued for their potential rather than their current performance. But there's a lot more nuance to it.

Coca-Cola (NYSE: KO) is a value stock that is praised for its consistency and reliable dividend, whereas Campbell's (NASDAQ: CPB) is a value stock because it is cheap compared to its earnings.

By investing $6,500 into each stock, you can expect to earn more than $500 in dividends per year, which can be useful for investors looking to incorporate passive income into their financial plan or supplement income in retirement.

Here's why Coke and Campbell's are both excellent buys now, but for completely different reasons.

A U.S. hundred-dollar bill on top of a keyboard with a chart and dollar signs.

Image source: Getty Images.

Coke's dividend is as reliable as it gets

Coca-Cola has been a standout in an otherwise abysmal consumer staples sector.
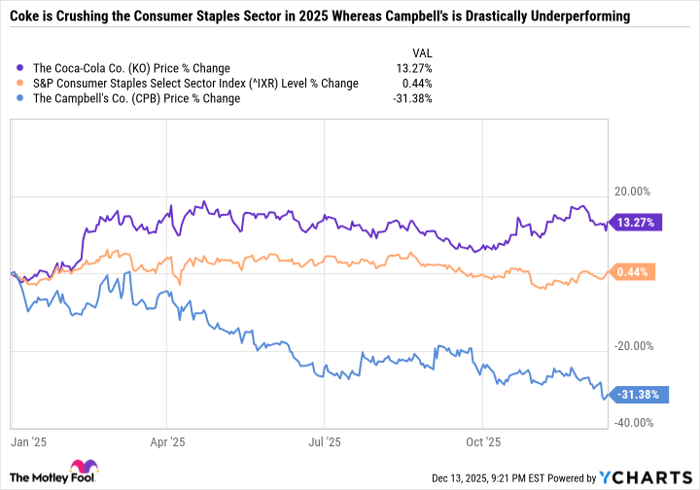
KO Chart

KO data by YCharts

Coke is performing well because it is navigating cost pressures and weak consumer demand better than its peers. The company's growth has slowed, but it still expects a 3% increase in non-generally accepted accounting principles (non-GAAP) earnings per share (EPS) and 5% to 6% non-GAAP organic revenue growth in its current fiscal year.

Coke's forecast for non-GAAP currency-neutral EPS growth is 8%, which is a testament to how well the core business is doing and the impact of currency headwinds.

Coke is generating solid free cash flow, which should help build on its 63-year streak of increasing its dividend. On its October earnings call, Coke CFO John Murphy said, "We're confident in our long-term free cash flow generation and have ample balance sheet capacity to pursue our capital allocation agenda, which prioritizes reinvesting in our business and returning capital to our shareowners."

All told, Coke's results are excellent within the context of the broader industry. Investors can count on its dividend, which yields 2.9% at the time of this writing. Coke has a reasonable valuation, trading at 23.7 times its projected $2.97 in non-GAAP fiscal 2025 EPS.

Campbell's brands are too good for the stock to be this cheap

Campbell's has a streaky track record of boosting its payout. But the yield sits at a whopping 5.4%, with the stock getting pummeled in 2025 and treading water near a 17-year low.

The company has not been able to offset inflation pressures because consumers are resisting price increases. But it believes it can tap into a shift toward cooking from home with health and wellness in mind.

One example is the Rao's brand of Italian sauces, which is growing faster than its peers even though it is at a premium price. The success of Rao's shows the nuances of consumer behavior, where it sits at the cross-section of cost savings and elevated at-home experiences, which Campbell's refers to as premiumization.

Another pillar of Campbell's growth strategy is health and wellness, which Campbell's is applying to both ready-to-eat meals and snacks. During its first-quarter fiscal 2026 earnings call on Dec. 9, Campbell's CEO Mick Beekhuizen said, "We are taking steps to further improve the health and wellness benefits of our Snacks leadership brands, for example, by providing consumers with avocado oil in our chips portfolio, and we have an exciting innovation pipeline for both the short and long-term."

Campbell's 2018 acquisition of Snyder's-Lance gave it a massive portfolio of snack brands, such as Snyder's of Hanover pretzels, Lance crackers, Kettle Brand and Cape Cod chips, and more. Campbell's also owns the Pepperidge Farm brand of cookies, such as Milano, which is performing well.

The Campbell's of today is so much more than condensed soup. It has several excellent brands across product categories and is well-positioned to tap into consumer behavior trends, such as eating without compromising on flavor. But investors will likely remain down on the stock until its results improve, as evidenced by Campbell's dirt cheap valuation -- which is just 11.5 times the midpoint of its full-year fiscal 2026 EPS guidance.

Consider a 50/50 split of Coke and Campbell's

Coke and Campbell's offer two distinctly different ways to boost your passive income stream.

Coke is the proven winner, with a more expensive valuation, better supply chain, elite marketing, and an ultra-reliable dividend.

Campbell's is the bargain-bin value play, with a higher yield and a portfolio of brands that is chock-full of potential.

For some investors, buying a 50/50 split of both stocks could be the best overall move for 2026. Equal parts of each stock would yield 4.2% -- an excellent rate for generating passive income. Coke and Campbell's also don't have overlap, as Coke's specialty is nonalcoholic beverages, whereas Campbell's wheelhouse is in snacks and meals.

Coke's valuation could be tested if its growth slows, but it is also already in favor with investors because it's delivering solid results. In the meantime, Campbell's is so cheap that it only needs to produce decent results, and the stock could recover.

Should you buy stock in Coca-Cola right now?

Before you buy stock in Coca-Cola, consider this:

The Motley Fool Stock Advisor analyst team just identified what they believe are the 10 best stocks for investors to buy now… and Coca-Cola wasn’t one of them. The 10 stocks that made the cut could produce monster returns in the coming years.

Consider when Netflix made this list on December 17, 2004... if you invested $1,000 at the time of our recommendation, you’d have $513,353!* Or when Nvidia made this list on April 15, 2005... if you invested $1,000 at the time of our recommendation, you’d have $1,072,908!*

Now, it’s worth noting Stock Advisor’s total average return is 965% — a market-crushing outperformance compared to 193% for the S&P 500. Don't miss the latest top 10 list, available with Stock Advisor, and join an investing community built by individual investors for individual investors.

See the 10 stocks »

*Stock Advisor returns as of December 16, 2025.

Daniel Foelber has no position in any of the stocks mentioned. The Motley Fool recommends Campbell's. The Motley Fool has a disclosure policy.

Disclaimer: For information purposes only. Past performance is not indicative of future results.
placeholder
U.S. November Nonfarm Payrolls: What Does the Rare "Weak Jobs, Strong Economy" Mix Mean for U.S. Equities?1. IntroductionAfter retreating from the late-October highs, U.S. equities embarked on a bottoming rebound in mid-to-late November, a trend driven by the interplay of multiple factors. That said, it i
Author  TradingKey
10 hours ago
1. IntroductionAfter retreating from the late-October highs, U.S. equities embarked on a bottoming rebound in mid-to-late November, a trend driven by the interplay of multiple factors. That said, it i
placeholder
Senate Delays Crypto Market Structure Hearings to Early 2026The Senate Banking Committee has postponed cryptocurrency market structure hearings until 2026, citing ongoing bipartisan negotiations.
Author  Mitrade
15 hours ago
The Senate Banking Committee has postponed cryptocurrency market structure hearings until 2026, citing ongoing bipartisan negotiations.
placeholder
Bitcoin Slides 5% as Sellers Lean In — Can BTC Reclaim $88,000?Bitcoin has dropped back below $88,000 after rolling over from $90,500, with price still trading under the 100-hour Simple Moving Average. The sell-off found a floor at $85,151, and BTC is now consolidating near that base, but rebounds are facing pressure from a bearish trend line around $89,000. Bulls need to retake $88,000–$89,000 to ease downside risk; failure to do so keeps $85,500–$85,000 and then $83,500 in play, with $80,000 as the deeper “line in the sand.” Bitcoin (BTC) is back in damage-control mode after a sharp pullback wiped out recent gains. The price failed to reclaim the $90,000–$90,500 band, rolled over, and slid through $88,500 before briefly dipping under $87,000. Buyers did show up around $85,000, but the rebound so far looks more like stabilization than a clear trend reversal. Bitcoin dips hard, finds a bid near $85,000(h3) BTC’s latest move lower began when it couldn’t build follow-through above $90,000 and $90,500. Once that upside stalled, sellers took control and pushed price down through $88,500. The slide accelerated enough to spike below $87,000, but the market didn’t free-fall. Bulls defended the $85,000 zone, printing a low at $85,151. Since then, Bitcoin has been consolidating below the 23.6% Fibonacci retracement of the drop from the $93,560 swing high to the $85,151 low — a clue that the bounce is still shallow and that sellers haven’t fully backed off yet. Structurally, BTC is still on the back foot: It’s trading below $88,000, and It remains below the 100-hour Simple Moving Average, keeping short-term trend pressure pointed downward. Resistance is layered, and $89,000 is the problem area(h3) If bulls try to turn this into a recovery, they’ll have to climb through multiple ceilings in quick succession. First, BTC faces resistance around $87,150, followed by a more meaningful barrier near $87,500. From there, the market’s attention snaps back to $88,000 — the level BTC just lost and now needs to reclaim. A close back above $88,000 would improve the tone, but it doesn’t solve the bigger issue: there’s a bearish trend line on the hourly BTC/USD chart (Kraken feed) with resistance near $89,000, which also lines up with the next technical hurdle. If BTC can push through $89,000 and hold, the rebound could extend toward $90,000, with follow-through targets at $91,000 and $91,500. But until price clears that $88,000–$89,000 zone, rallies are at risk of being sold rather than chased. If BTC fails to reclaim resistance, the downside path is clear(h3) The near-term bear case is simple: if Bitcoin can’t climb back above the $87,000 area and keep traction, sellers may attempt another leg lower. Support levels line up like this: Immediate support: $85,500 First major support: $85,000 Next support: $83,500 Then $82,500 in the near term Below that, the major “don’t break this” level is still $80,000. If BTC slips under $80,000, the risk of acceleration to the downside increases significantly — not because it’s magic, but because it’s the kind of psychological and structural level that tends to trigger forced de-risking. Indicators: momentum still leans bearish(h3) The intraday indicators aren’t offering much comfort yet: Hourly MACD is losing pace in the bearish zone. Hourly RSI remains below 50, suggesting sellers still have the upper hand on short timeframes. So while the $85,000 defense held for now, the market hasn’t flipped bullish — it’s just stopped bleeding.
Author  Mitrade
18 hours ago
Bitcoin has dropped back below $88,000 after rolling over from $90,500, with price still trading under the 100-hour Simple Moving Average. The sell-off found a floor at $85,151, and BTC is now consolidating near that base, but rebounds are facing pressure from a bearish trend line around $89,000. Bulls need to retake $88,000–$89,000 to ease downside risk; failure to do so keeps $85,500–$85,000 and then $83,500 in play, with $80,000 as the deeper “line in the sand.” Bitcoin (BTC) is back in damage-control mode after a sharp pullback wiped out recent gains. The price failed to reclaim the $90,000–$90,500 band, rolled over, and slid through $88,500 before briefly dipping under $87,000. Buyers did show up around $85,000, but the rebound so far looks more like stabilization than a clear trend reversal. Bitcoin dips hard, finds a bid near $85,000(h3) BTC’s latest move lower began when it couldn’t build follow-through above $90,000 and $90,500. Once that upside stalled, sellers took control and pushed price down through $88,500. The slide accelerated enough to spike below $87,000, but the market didn’t free-fall. Bulls defended the $85,000 zone, printing a low at $85,151. Since then, Bitcoin has been consolidating below the 23.6% Fibonacci retracement of the drop from the $93,560 swing high to the $85,151 low — a clue that the bounce is still shallow and that sellers haven’t fully backed off yet. Structurally, BTC is still on the back foot: It’s trading below $88,000, and It remains below the 100-hour Simple Moving Average, keeping short-term trend pressure pointed downward. Resistance is layered, and $89,000 is the problem area(h3) If bulls try to turn this into a recovery, they’ll have to climb through multiple ceilings in quick succession. First, BTC faces resistance around $87,150, followed by a more meaningful barrier near $87,500. From there, the market’s attention snaps back to $88,000 — the level BTC just lost and now needs to reclaim. A close back above $88,000 would improve the tone, but it doesn’t solve the bigger issue: there’s a bearish trend line on the hourly BTC/USD chart (Kraken feed) with resistance near $89,000, which also lines up with the next technical hurdle. If BTC can push through $89,000 and hold, the rebound could extend toward $90,000, with follow-through targets at $91,000 and $91,500. But until price clears that $88,000–$89,000 zone, rallies are at risk of being sold rather than chased. If BTC fails to reclaim resistance, the downside path is clear(h3) The near-term bear case is simple: if Bitcoin can’t climb back above the $87,000 area and keep traction, sellers may attempt another leg lower. Support levels line up like this: Immediate support: $85,500 First major support: $85,000 Next support: $83,500 Then $82,500 in the near term Below that, the major “don’t break this” level is still $80,000. If BTC slips under $80,000, the risk of acceleration to the downside increases significantly — not because it’s magic, but because it’s the kind of psychological and structural level that tends to trigger forced de-risking. Indicators: momentum still leans bearish(h3) The intraday indicators aren’t offering much comfort yet: Hourly MACD is losing pace in the bearish zone. Hourly RSI remains below 50, suggesting sellers still have the upper hand on short timeframes. So while the $85,000 defense held for now, the market hasn’t flipped bullish — it’s just stopped bleeding.
placeholder
AUD/USD remains depressed below mid-0.6600s; downside seems limited ahead of US NFP reportThe AUD/USD pair attracts some sellers for the fourth straight day on Tuesday and trades around the 0.6630 region, down just over 0.10%, during the Asian session.
Author  FXStreet
19 hours ago
The AUD/USD pair attracts some sellers for the fourth straight day on Tuesday and trades around the 0.6630 region, down just over 0.10%, during the Asian session.
placeholder
Macro Analysts: Hawkish Japan Could Push Bitcoin Below $70KAnalysts predict Bitcoin may face further declines towards the $70,000 mark if the Bank of Japan raises interest rates as expected.
Author  Mitrade
Yesterday 05: 48
Analysts predict Bitcoin may face further declines towards the $70,000 mark if the Bank of Japan raises interest rates as expected.
goTop
quote